
Affordable housing has been a hot topic in recent years, and is even more so now as rental vacancy rates are extremely tight and housing prices have experienced record rates of increase in Atlantic Canada. A recent news article caught my attention, with its reference to a price point – “attainable” – I haven’t heard as much about, and it inspired me to take a look at what the difference is, and how each lines up with Atlantic Canadian markets. Then, because alliterations sound better in threes, I needed a third A: the obvious choice in this context is to look at availability.
First, the definitions, a slipperier thing to pin down than one might imagine. Canada Mortgage and Housing Corporation (CMHC) defines affordable housing as housing that costs less than 30% of a household’s before-tax (gross) income, absent any requirement for the housing to be provided or made possible through a government program, and without restriction on tenure or type.
With that definition, affordability is very much relative: in theory, a $4.3-million home would be “affordable”, provided your household income is $300,000 – about 1.7% of Atlantic Canadian households.

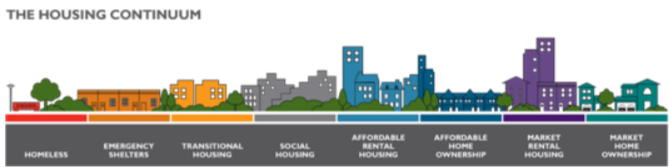
Seems likely that this is not the intention of the definition, or any measures put in place to encourage the supply of affordable housing. And in fact, CMHC’s Housing Continuum graphic implies that affordable housing is separate from market housing. Wikipedia offers a slightly more specific definition:
…housing which is deemed affordable to those with a median household income or below as rated by the national government or a local government by a recognized housing affordability index.
If we combine the two, that would indicate that affordable housing is housing which costs no more than 30% of the median household income – and for practical purposes, let’s assume that is in reference to local median incomes, and not, for example the national figure…more on that later.
We conducted a very high-level analysis of the median incomes for the four Atlantic provinces and a selection of cities. We used average rental rates for 2-bedroom units because this is by far the dominant unit type for rental accommodation. The calculation is simple (very!): divide 30% of the median household income by 12 to get the monthly income, subtract off the average rental rate and an allocation for utilities of $150 per month (property tax and water are included in the rental rate; electricity/heating may or may not be included, so to play it safe, we assumed that it’s not for most units) and see what’s left over. Great news: positive balances all-round, averaging $620 per month surplus – hoorah, there’s no affordability issue!
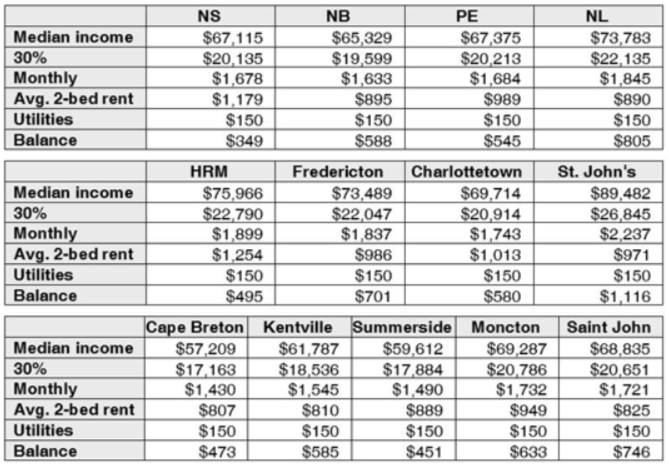
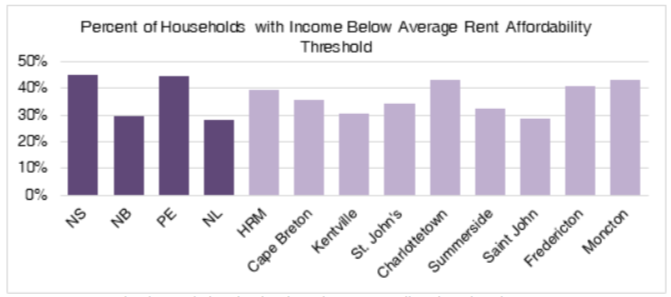
Here’s the “but”…and it’s not inconsequential by any stretch. Median household income is, by definition, the middle of the income spectrum. So, a household earning the median income being able to afford average costs for rental housing tells only half the story. Our next analysis worked the figures backwards: we took the average rent plus the same allocation for utilities, on an annual basis and figured out how much a household would need to earn in order for housing costs to equal 30% of their gross income – then figured out approximately how many households fell below that income threshold, based on the number of households in various income brackets. Reports of an issue don’t look overblown at all.
Prices for owner-occupied housing have increased substantially over the course of the pandemic. We ran the same sort of analysis as above, for average/median sale prices in 2020 and 2021. The geographic availability of data is a bit inconsistent, but our aim is a general idea, so overall, the data is fit for purpose. Mortgage rates impact the cost of housing; we used discounted rates (rather than the posted rates) relevant at the relative times. To keep things simple, we assumed a 5% down payment, then based on a very unscientific poll around the office cross referenced against an online monthly expenses calculator, we allocated 40% of the mortgage cost to cover property tax, utilities, and insurance costs: rough idea, fit for purpose.
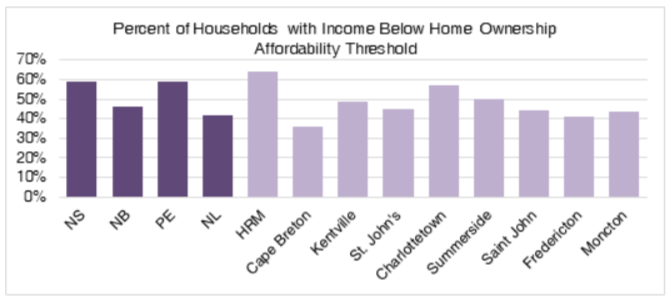
We also looked at the year-over-year change in house prices: in 2020, the median income was sufficient to afford a house in all Atlantic provinces, and the selected cities (2020 house price data for Moncton is conspicuous by its absence), but in 2021, the income needed to afford a typical house climbed over the median level for Nova Scotia and PEI, and their capital cities.
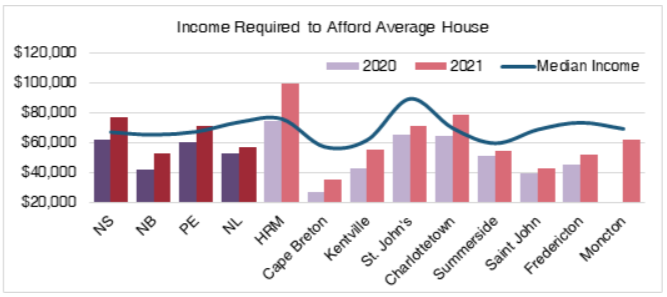
Obviously, averages and medians are the central figures: there will be houses priced lower as well as houses priced higher, so the above analysis is not to say that in HRM, for example, you couldn’t find a house priced within your means if your household income is less than $100,000 (though it’s getting trickier, especially with our recent embrace of the “offers over” system of home buying). But this does provide an indication of affordability, and leads us to the next A on the list: attainability.
Again, the definition is slippery, and in some senses, attainability is defined the same way as affordability, i.e., at no more than 30% of gross household income. It seems that the key difference is the removal of reference to median income: each income bracket will have its own price range of attainable housing – and associated appropriate housing types, categorized by type, size, and tenure. Implicit in the idea of attainability is that suitable housing exists in the local market in a variety of forms and price points, sufficient to meet the needs of the population.
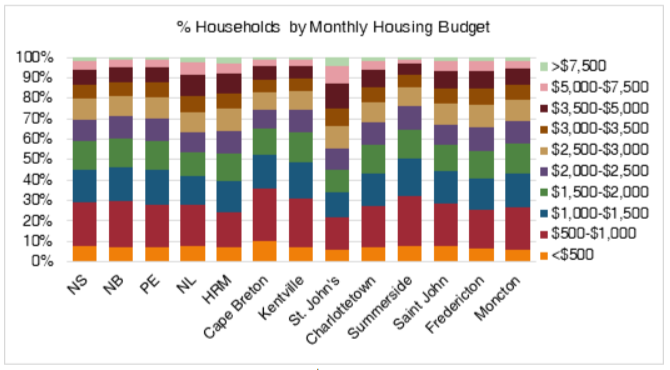
We used data on household income brackets to model the proportion of households in each province/city by maximum monthly housing budget. We then used the same $150 allocation for utilities for rental units to determine affordable rental ranges, and the same ratios for expenses-to-mortgage (i.e., 60% of budget is available to service the mortgage, with 40% allocated to property tax, utilities, and insurance) to determine affordable house prices, as were used in the earlier analyses. All figures are approximate at best and should not be relied upon for life decisions, but they give a sense of what is attainable to each income bracket from a price perspective.
And so we come to the final A: availability. It’s an important one, because it’s effectively the supply side of the supply and demand equation, which is the driving force behind prices. For this portion of the discussion, we’re abandoning price points in the interest of balancing level of effort that can be allocated to a blog post.
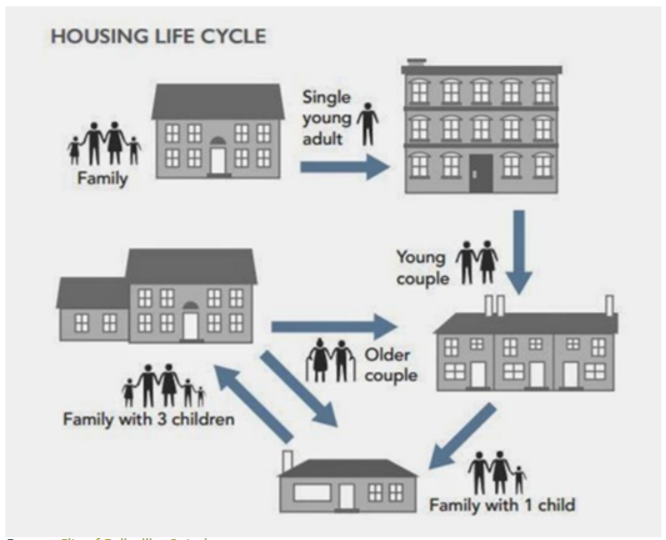
One of the components of the attainable definition was that a variety of housing formats would be available locally to serve the various budgets – the CMHC housing continuum graphic gives a rough sense of what this might look like, as does this Housing Life Cycle graphic borrowed from the City of Belleville, Ontario.
From an availability perspective, we start with rental tenure. With the exception of Cape Breton and St. John’s, vacancy rates are low across the selected cities.
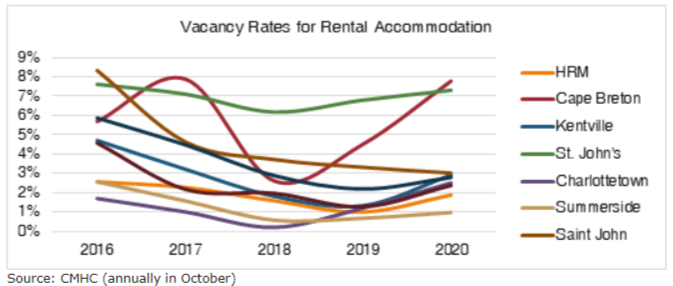
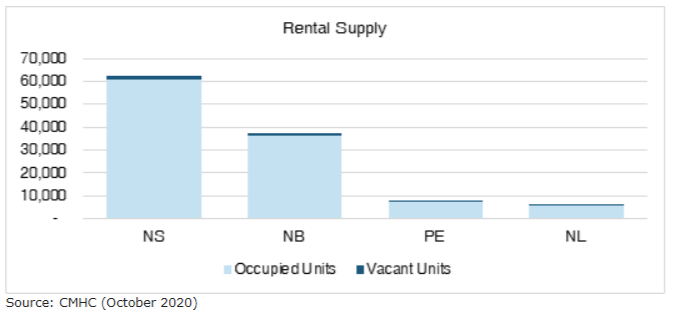
At a provincial level, in October 2020, there were just over 3,000 vacant rental units in Atlantic Canada, of a total rental universe just shy of 114,000 units. Once those 3,000 units are sliced and diced by price, style, and location, availability is probably problematic.
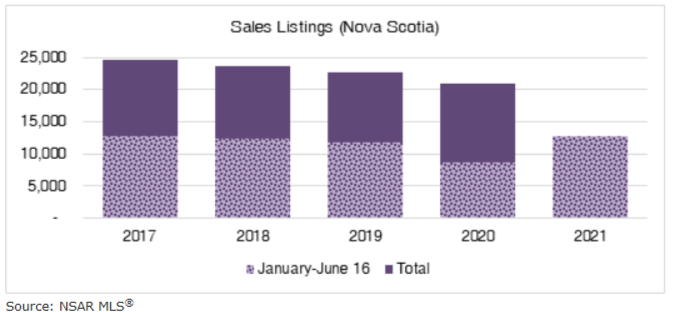
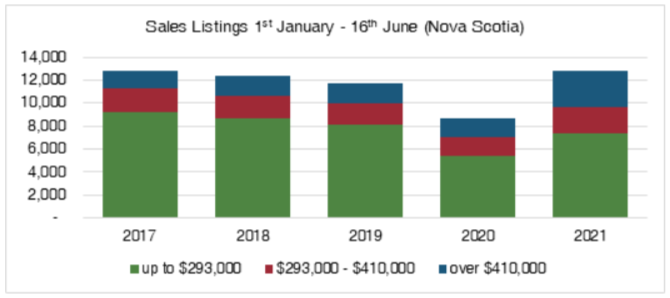
For residential sales listings, we have to rely on data for Nova Scotia only, due to availability, but we suspect that a similar pattern will be in evidence in the Maritime provinces at least. Prices continue to climb in 2021, but it appears that the supply-side driving force behind that trajectory may no longer be in play: the number of listings for the period 1st January to 16th June in 2021 was greater than any other year in the past five years, versus 2020, which had the fewest listings of the five years.
But what about affordability of these available houses? That’s a question that could have many answers – in that it can be answered in a myriad of ways. We’ve opted for a very simple one, using price points of affordability for the median household income under two interest rate scenarios: the current posted rate and a current available discounted rate, and ignoring down payments because we’re more concerned with monthly costs in this analysis. We’ve also ignored time – and changes to mortgage rates and income levels over its course, for illustrative purposes (horseshoes, hand grenades, and this blog post).
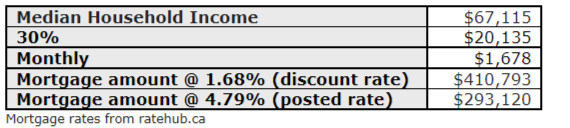
Let’s just pause on the one-hundred-and-seventeen-thousand-dollar difference in what is “affordable” under those two rates. In some areas, you could buy a house for that. Maybe not for much longer, if interest rates stay low, but there are rumblings from economists that as interest rates rise, the “affordability” of houses will contract and what some fear is a housing bubble, may burst.
The second half of 2021 is yet to be, so here are the Nova Scotia listing counts annually to 16th June. A few things jump out: (1) there were more listings in the first half of 2021 than in the same period of any other year in the past five (we already knew that from earlier); (2) other than at the outset of the pandemic, when home was so distinctively the safest place to be and few wanted to let strangers walk through theirs, 2021 had the fewest listings below the posted interest rate affordability threshold; and (3) 2021 had the fewest listings below the discounted interest rate affordability threshold, full stop.
Back to that mention of localized median household incomes. In the absence of sufficient NOAH (Naturally Occurring Affordable Housing: see TDP VP Neil Lovitt’s excellent blog from earlier this year) in the region, programs that encourage affordable units in new developments are an important part of the solution moving forward.
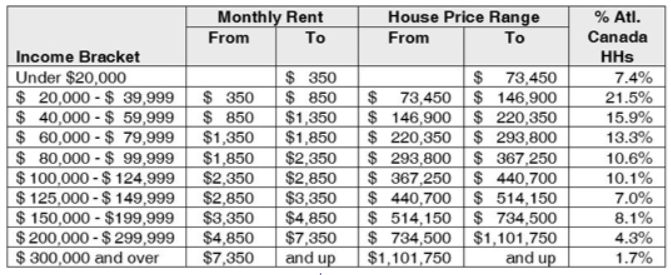
There’s a knife edge on which balances the costs of development with what is affordable to those who need non-market housing. It is highlighted by reaction to a recent announcement of a sizable federal loan on a new apartment building that will be approximately one-quarter designated affordable units. They’ll be priced in relation to the median income for the area, which has generated a fair bit of blow back (to be fair: the perception of how widespread negative reviews of policy are is almost certain to be skewed, since those who really disagree are far more likely to speak out against it, while those who agree or are neutral have less incentive to chime in on the discussion). The issue they raise is that the local (Halifax) median income referenced is close to $90,000 (as in, one large Costco order close to), so the affordable units could be priced as high as $2,238, though most are actually going to be less than that since the agreement includes provision for a further discount to the 30%‑of‑median‑income standard. The underlying questions in the flak are really: is median income a reasonable metric on which to base affordability measures? And what median should be used? And is there any relationship between the maximum “affordable unit” price tag and unit size? One-bedroom versus four at $2,200 is a pretty substantial difference.
There’s a geographic driver of housing prices, and it costs more to commute less, generally. Maclean’s magazine published an analysis in 2014 that showed a minute of driving time could save you thousands in housing costs. Inspired, we devoted a TDP Trends to the topic; with some variation, in general, the farther you get from the downtown core, the less expensive houses are.
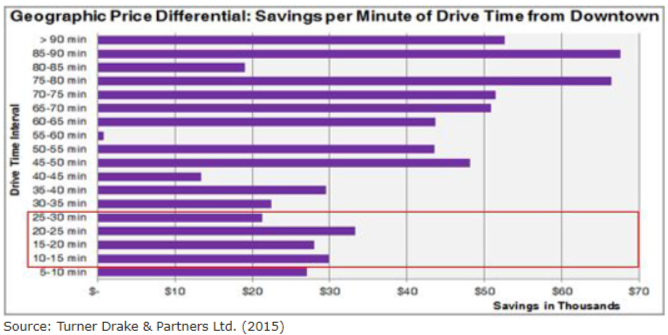
This is relevant to a discussion of housing that is affordable, attainable, and available because cars are expensive to own and operate. Pushing affordable housing to the far reaches of the city, where transit options are limited/nil (and don’t forget that commute times via bus are going to be longer), is short-sighted at best, and counter-productive at worst. But median incomes are likely higher where housing prices are higher, whether that’s localized within a city, or the city median is used in lieu of the provincial one.
Is there a conclusion? Not in terms of a solution. But an acknowledgement of the complexity of the issue, and the fact that a broad stroke approach to the metrics may provide little in the way of assisting those who need support to find and keep suitable housing that fits both the budget and the family structure. That, and the fact that “affordable housing” as defined, is only of use if it is also attainable and available.

Turner Drake refines high-level, surface-scratching analyses like the foregoing, into fine-grained, location specific consulting assignments, including market and non-market housing supply and demand analyses throughout Atlantic Canada, and Housing Needs Assessments from coast to coast. To see how we can provide solutions to your real estate problems, you can reach Alexandra Baird Allen at (902) 429-1811 or .