
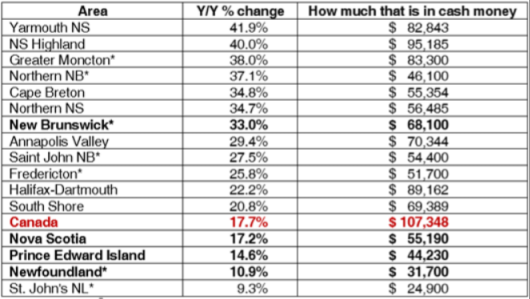
We’re all well aware of the trajectory of housing prices since the start of the pandemic: The Canadian Real Estate Association (CREA) reported a 17.7% increase in average housing prices nationally between December 2020 and 2021. Reported increases in Atlantic Canada range from 9.3% in St. John’s NL, to 41.9% in Yarmouth NS. We’ve arranged the following table of reported Atlantic Canadian areas in descending order by rate of increase, and included the dollar value that increase translates to.
Another thing we’re all aware of is current rock bottom interest rates, which were lowered from already low levels at the outset of the pandemic in an effort to keep the economy from coming to a crashing halt. As someone who first bought a house when interest rates seemed low to those who held a mortgage in the 1980s, but high to those who weren’t yet born in the 1980s, I wanted to take a look at the cost of buying a home with a mortgage over the course of the past few decades, and how that relates to income.
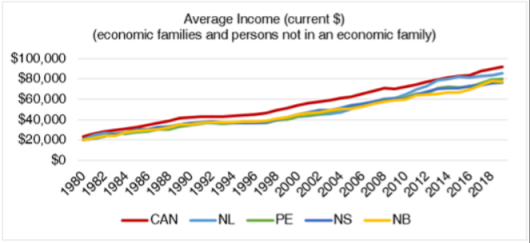
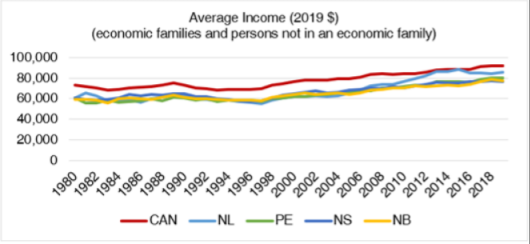
The following charts show average income for “economic families[i] and persons not in an economic family[ii]”. The available data goes as far forward as 2019 and it was provided in constant 2019 dollars. I wanted to look also at current dollar income, so I adjusted it using the relevant consumer price index (CPI). Over the past four decades, average incomes have approximately quadrupled in Canada (+290%) and the Atlantic provinces (NL +318%; PE +291%; NS +284%; NB +295%; maybe a little more since 2019?)
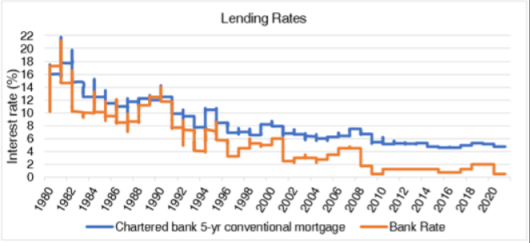
Historic lending rates are provided on a weekly basis. From the start of 1980 to the start of 2022, lending rates have declined substantially, by 8.46 percentage points (pp) for posted mortgage rates and 13.5 pp for the bank rate. Mortgage rates peaked at 21.75% for a 10-week period in 1981 and reached their lowest between 2015 and 2017, at 4.64%.
And the final piece of the puzzle is housing prices. Part of our Compuval™ suite of databases is our residential database, which captures details of housing sales transactions in Halifax Regional Municipality, dating back to the mid-1970s. So, with apologies to all the other areas, for this portion, we are looking only at the housing prices for HRM. The average price for a house in 1981 was $60,738; in 2021, it was $486,861, an increase of just over 700%, well above the quadrupling of incomes over the period.
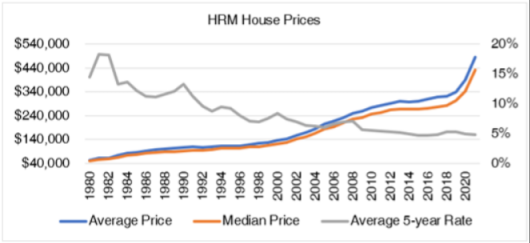
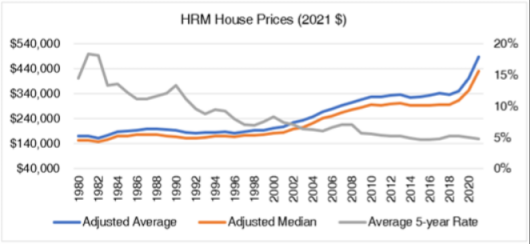
We also used the CPI to adjust average housing prices to 2021 levels: the increase over the forty years was 187%, even accounting for inflation.
No matter which way you look at, adjusted or otherwise, housing prices have increased over the past 40 years (what??!), and quite sharply over the past 2 years. But interest rates have declined, so where does that put mortgage payments? The following two tables show mortgage payments on the average priced home annually since 1981. The mortgage rates are necessarily approximate because mortgage rates vary throughout the year – these are the annual averages of the reported weekly rates – and because there are other factors at play that might mean someone pays a different rate from that posted (negotiation, general discounts off the posted rate, etc.), but the purpose here is to show the trend over time. I’ve also ignored down payments, so these payments are based on the full average price of houses, purely for simplicity. The first table shows the five-year fixed rate, while the second shows the variable rate; payments are shown on average house prices in current dollars, and also adjusted to 2021 dollars using the CPI.
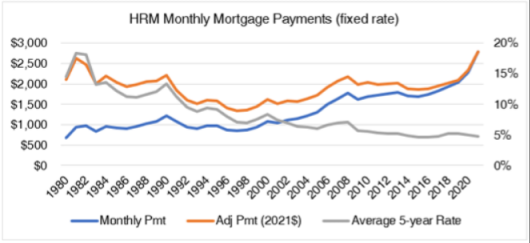
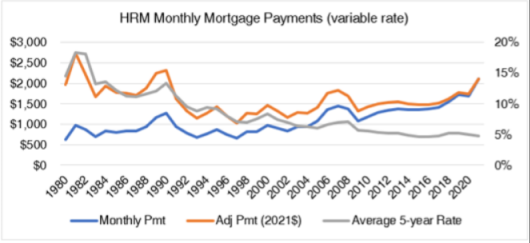
The analysis shows that interest rates and mortgage payments followed a similar pattern until approximately the year 2000 for fixed rate mortgages, and 2009 for variable rate mortgages, at which points the two diverge, with interest rates continuing their downward trajectory while mortgage payments climbed with relative consistency to the present day (side note: over the study period, there were just three years where the annual average for variable rates was higher than that of fixed rates: 1981, 1989, and 1990).
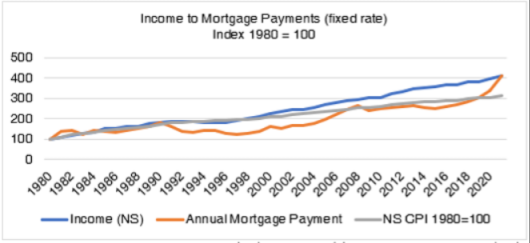
“Affordability” for housing is relatively refined in its definition (you can read a bit about it in our blog from June of last year), and this next table isn’t intended to comment on affordability in that regard, but rather to show the pattern of change in average incomes, annual mortgage payments, and consumer prices (CPI), all indexed to a common starting point (1980). It is noteworthy how closely together the three moved between 1980 and 1990, at which point annual mortgage payments dropped relative to income and CPI; the latter two continued apace for about the next eight years, till incomes started to outpace consumer prices. Even in 2020, the index for annual mortgage payments fell below that of income, but in 2021, these two came back together, suggesting that mortgage costs (index value in 2021 = 411.7) relative to income (index value in 2021 = 414.4) is now approximately equivalent to where it was in 1980 (both 100), or 1990 (index values 181.7 and 184.8, respectively).
One more exercise in modelling prices, payments, and interest rates: what would someone pay, including interest, if they bought an average house in 1981, versus in 2021? In order to estimate this, I used a 25-year amortization period with 5-year terms. For the first 5-year term, I used the average house price and fixed mortgage rate in the year of purchase, and then used an amortization schedule to determine the balance owing at the end of the term. I repeated the process for each of the 5-year terms, using the end balance for the previous term as the mortgage amount, reducing the amortization period by five years, and using the prevailing interest rate of the first year of each term. This is reasonable for the 1981 purchase, but the 2021 purchase is trickier because future interest rates are unknown. Therefore, I simply modelled it looking backwards at interest rates in five-year increments, on the assumption that maybe rates will work their way back up. Is it perfect? No. Is it reasonable? Probably. Is it interesting to speculate? I think so.
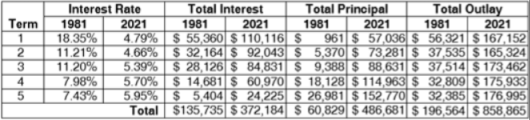
The results: an average house purchased in 1981 cost $60,738; when fully paid off 25 years later, the total cost of principal and interest was $196,564 (note that the starting principal and total principal are off by $91, likely due to rounding). The average house purchased in 2021 cost $486,681. The full cost including principal and interest 25 years hence is modelled to be $858,865.

Alex Baird Allen is the Manager of Turner Drake’s Economic Intelligence Unit. In her role, Alex frequently undertakes market surveys, site selection studies, trade area analyses, supply & demand analyses, and demographic reports for a wide range of property types throughout Atlantic Canada. If you’d like more information on market research or our semi-annual Market Survey (recently updated and published with December 2021 results), you can reach Alex at 902-429-1811 Ext.323 (HRM), 1-800-567-3033 (toll free), or email
[i] “An economic family refers to a group of two or more persons who live in the same dwelling and are related to each other by blood, marriage, common-law, adoption or a foster relationship.” – Statistics Canada.
[ii] “A person not in an economic family is a person living either alone or with others to whom he or she is unrelated, such as roommates or a lodger.” – also Statistics Canada.