
Well, last year certainly was one for the history books. Of all the issues amplified by the pandemic in 2020, housing and its affordability has been among the most universal, and the most important. Tight vacancy and escalating rents, construction cost and process challenges, plummeting interest rates and a dearth of listings, CERB and eviction bans, renovictions and rent control, escalating homelessness and guerilla shelters. The jury is still far out on 2021, of course, but the challenges and conversations around housing show no signs of a speedy resolution.
I’ve been trying and failing for some time to write about housing; what’s been happening in our region, and how those trends have been affected by the ongoing pandemic. Part of my challenge has been simply keeping up to date – these days you can’t go more than a week or so without getting hit with some new and relevant information. Another part of my challenge has been the complexity of the issue. Housing is the bottom line that many personal, economic, and policy issues fall down to; it is difficult to understand one major facet of the issue without an appreciation for the others.
Originally my goal for this piece was to do a punchy listicle with a couple interesting data points. In my naivete, I established a working title of “3 Charts to Explain Housing”. However, I’ve found it impossible to weave together anything worth saying using so few threads. So, with apologies to our ever-patient marketing staff and any of you who were wishing for a light read, I give you: Seven Facets of Our Housing Situation Explained (with eight charts).
POPULATION GROWTH
While the COVID-exodus to Atlantic Canada from elsewhere in the country has received much media attention over the past few months, it is really a sideshow. Despite the interesting anecdotes about sight-unseen sales in (formerly) sleepy markets, or Realtors® conducting showings via Zoom, overall interprovincial migration is not significantly different in 2020. We have longer term and more fundamental growth drivers affecting our region. Many of these have been a significant source of housing demand over recent years, but in some cases, have waned under pandemic conditions:
Oil Patch Kaput
During the tar sands heyday from late 2004 to late 2015 out-migration from Nova Scotia to Alberta averaged about 1,250 people every quarter. That’s one Antigonish per year. For eleven years straight. These days, with oil trading at half its price, the exodus has collapsed by a similar proportion while in-migration from Alberta has remained comparatively steady. The result: in the 62 quarters from Q1 2000 to Q2 2015, net migration from Alberta to Nova Scotia was positive only 3 times. In the 21 quarters since (no data yet for Q4 2020), it’s only been negative once. A penny saved is a penny earned.
Real Estate Refugees
Yes, there is certainly a notable inflow of population and home-buying capital from other Canadian regions that have experienced stronger price appreciation, and worse pandemic performance. The work-from-home narrative dominates the conversation on this, but it is not the whole story. This is a combined house price arbitrage play with the beginnings of a structural trend, principally from Ontario and British Columbia, driven by population aging as households execute longer-standing plans to retire Down East. It has been going on for several years, with 2017 being a breakout after Toronto and Vancouver posted eyewatering year-over-year house price increases. The after-spring bump in 2020 from ON and BC is only about 10% higher than the same period last year.
Increasing Immigration
The immigration story was really kicked off in 2016 with the much-publicized landings of Syrian Refugees however other streams for entry really took things from there. Nova Scotia went from welcoming about 610 international immigrants per year (2005-2015 average), to more than 1,390 per year since. Numbers have waned in 2020, obviously, but the Federal Government was early to state that immigration, and increased immigration at that, is a core element of its post-pandemic economic recovery plans. We therefore expect this trend to pick right back up as vaccination is rolled out globally.
Student Bodies
Efforts to recruit international students (and their sizable tuition fees) have been front and centre for post-secondary institutions for some time. However, the Trump presidency apparently supercharged things as a significant number of prospective students have diverted to other western countries who didn’t follow the same nationalistic and isolationist path. This is such an interesting twist of fate that it deserved its own chart:

Again, the pandemic has had an understandable dampening effect as travel has become restricted and classes moved online, but this is a temporary blip. With sanity restored to the White House, however, it will be interesting to see how quickly, and to what extent, this trend recovers in Canada.
Added together, we get a picture of population growth which has been driving strong housing demand for a period well before a coronavirus turned the world upside down.
In fact, the pandemic has decelerated the net impact of these demand drivers, evidenced in CMHC’s 2020 Rental Market Survey which found apartment vacancy in Halifax rising significantly from its previous record low… though it remains too low.
SUPPLY RESPONSE
All of this new population needs shelter, demand requires supply. Adequate housing supply, in and of itself, does not solve all housing challenges. However, making sure we are expanding our housing inventory in pace with our population growth is a fundamental piece of the puzzle solving some issues, and making many others a lot easier to deal with. Supply and demand interact like tectonic forces in housing markets, any of the other actions we might take are done in their context. Let’s take a look at the Halifax area, which is generally where most of the province’s population growth is landing. How have we been doing?
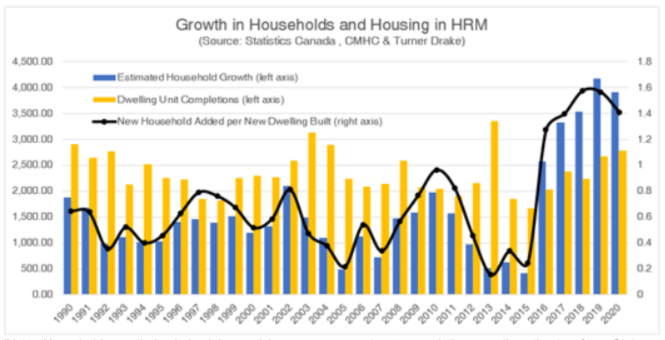
Not good.
Typically, it would be excessive to examine this data over a 30-year period, but here it is necessary to show just how unprecedented the current growth disparity between people and shelter is in Halifax. For the entire time series Halifax only rarely approached – and never exceeded – an even level of housing construction for each household added to the city. Each time that it did, the industry responded with stronger building rates. This is important as demand is also increasing from shrinking household sizes within the existing population in addition to this incremental demand from growth. In 2016 Halifax blew past that previous ceiling, adding more households than houses for the first time in at least three decades, and more importantly, sustained these historic levels of under-building for 5 years and counting! The first rule of getting out of a hole is to stop digging.
CREDIT
As debt becomes cheaper to carry and more easily accessed, it inflates the value of assets. Falling yields on risk-free vehicles like government bonds drive investors to seek higher returns, and the same low rates that motivate this behavior mean the system is flushed with credit on which to acquire these assets. For decades, interest rates have been in secular decline, and this was accelerated significantly in 2009 when the Great Financial Crisis ushered in the era of emergency near-zero rates which have seemingly evolved into permanently low rates. Or perhaps the emergency is now permanent, it is sometimes hard to say.
Real estate is an illiquid asset, which means transactions in the market are heavily influenced by the marginal buyer; those who are willing and able to outbid all others for the property, and thereby set the bar for valuation. We observe the impacts of this monetary policy context clearly in the commercial real estate sector as cap rates have compressed, amplifying the market value of properties independent of changes in the income they generate. A similar effect is felt in the residential sector, where increasing mortgage credit acts as an accelerant in any market with a whiff of demand, launching prices higher, even as the incomes that support them lag.
The chart below shows the results of a simple model that applies typical mortgage parameters to annual house price, income, and interest rate data to plot the changing relationships between income, purchase price, and mortgage carrying cost. In the data since 2000, incomes have increased by about 70%, new house prices by 200%, and average interest rates have dropped by 50%.
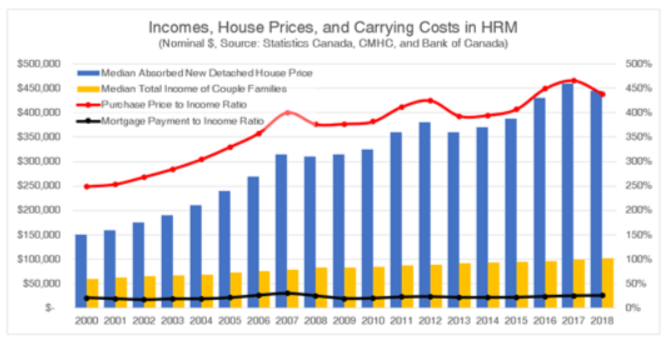
The resulting price to income ratio skyrockets by nearly 190 percentage points as a result. However, the countervailing force of loosening credit means the actual carrying cost of that price, which is what households actually pay (because we don’t buy homes, we buy mortgages), is only up 5 percentage points over the same period and generally fluctuates up and down within a tight 15 point range.
This is the critical mistake made by those who talk about housing prices as being “detached” from incomes. House prices are attached to incomes, firmly, by the sinews of credit. As it has eased, that connection has lengthened, but the relationship is just as firm. In fact, it is more accurate to describe this relationship in the inverse; it is largely because interest rates have fallen that prices have gone up! If interest rates were to reverse their long-standing trend, we would see how quickly this detachment narrative disappears.
DISAPPEARING NOAH
Naturally Occurring Affordable Housing, in housing policy parlance, is a somewhat new and misleading term that basically refers to unsubsidized housing that exists within the private market at a relatively affordable price. Think classic shoebox 3-story walkup apartment buildings (though it can come in any form). Without non-market interventions such as capital grants or operating subsidies, this housing is affordable mostly because it is less desirable relative to other options in the market, and this is principally a function of when it was built. Buildings go down in relative value over time, or depreciate in valuation parlance, because they go out of style, they get rundown and tired, they lack design features and amenities that more recent buildings have, they are more likely to suffer pest nuisances… if competition is the mechanism by which markets work, these buildings are losing the competition.
This part of the housing inventory is critical for those employed in entry-level positions or lower-income industries. However, as NOAH is still firmly within the housing market, it is subject to market forces. In times of growing demand, the lower end of the market is generally where renovations and recapitalizations become feasible first. In and of itself, this is a good thing. We want our building stock to receive reinvestment and cycle back up through the market instead of declining into uninhabitability. However, that idyllic impression of market function is running into some cold realities.
The first is a quirk of our development history. The chart below shows the distribution of apartment inventory in Nova Scotia by building age (we have removed the comparatively minor contribution of buildings built pre-1950 for the sake of our x-axis). With regular maintenance and the occasional replacement of major building systems like roofs and HVAC, that typical midcentury shoebox building may be expected to last 50 or so years before a complete revamp is required to extend its lifespan.
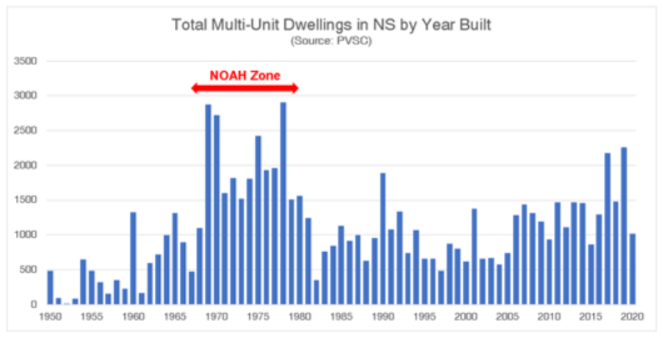
At any given time there is a continuous stream of building stock aging down and being recycled back up through the market, but a disproportionately large section of the apartment inventory is now coming due. Units constructed during the boom of the 70s are turning over, and there are far fewer units next in queue replace them at the bottom. Particularly cruel examples notwithstanding, this dynamic is largely responsible for the increasing prevalence of “renoviction” stories that we’ve seen in the media over the past couple years. Our total supply of NOAH is dwindling.
INCOME INEQUALITY
The second reality affecting the ability of NOAH to adequately serve lower income households is the fact that those households are falling further behind. The majority of households in rental housing are in the bottom 40% of the income distribution. The chart below shows how incomes (adjusted for inflation) have changed over time.
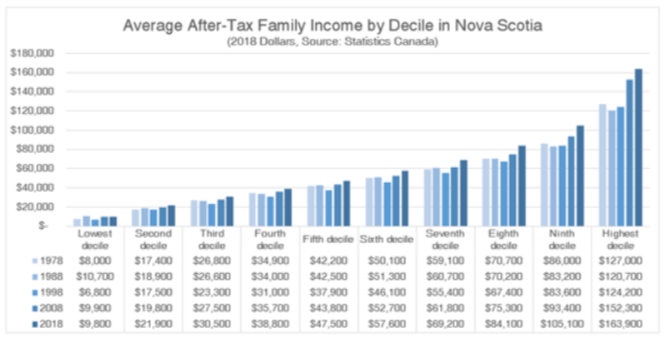
This of course does not reflect the added issue of declining income mobility, highlighted in recent research from Statistics Canada. Still, even this incomplete picture is concerning: over four decades real family incomes in this lower 40% have, at best, increased by less than $4,000 or about 0.26% per year. Unfortunately, the operating expenses of the buildings they occupy (property taxes, utilities, construction materials, insurance premiums, contractor and trade labour, etc.) are growing at a much higher rate. Compounded over decades this means rent in stable, older buildings – even if run on a break-even financial model – will increasingly outpace the ability of many renter households to afford them.
This is mostly a renter’s issue, but it affects those in owner-occupied housing as well. Though interest rates have maintained affordability in the carrying costs of mortgages, other costs associated with home ownership, such as down payments, have become increasing barriers to entry. Ultimately, the spectrum of the population that the housing market serves is getting narrower, and a big part of that issue (especially the “crisis” part) is due to stagnant household finances and stagnant social supports as inequality in our society grows.
SUPPLY OF NON-MARKET HOUSING
The third reality is the availability of housing options for those who are finding themselves outside of the limits of the market. Canada as a whole has not engaged much in the production of social housing, especially since the late 80s and early 90s as the federal government unwound their previous decades of involvement. Yet, even by these low standards Nova Scotia has the dubious distinction of being the second worst province in terms of adding to its stock of non-market housing since 1990:
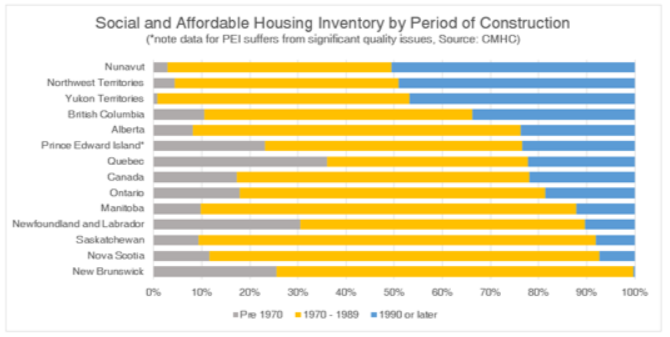
A brief pause here to look over the rim of my glasses at New Brunswick which has apparently built all of thirteen (!) units in the last three decades. This data is from CMHC’s inaugural Social and Affordable Housing Survey, so hopefully in future updates more units will be identified.
Barely more than 7% of Nova Scotia’s non-market inventory has been built since the 90s, and I would wager the proportion for more recent decades is closer 0%. Over this same timeframe, all housing completions tracked by CMHC totaled nearly 98,000 units, meaning only 0.93% (910 units) of what we’ve built has gone towards increasing our non-market inventory.
Now, this is at least somewhat understandable. Up until recently Nova Scotia has been able to coast along without too much trouble thanks to stagnant population growth and the ability of NOAH to take considerable pressure off the waitlists for non-market options. Well, those days are over. If there was one thing the Province could do without having to wait for their Affordable Housing Commission to tell them, actually increasing the inventory of social housing would be it!
IMPORTED DEMAND
Finally, we get to the Boogeymen. For those who subscribe to the “detachment” perspective described earlier, the thought process is straight forward enough; if local fundamentals are not viewed as an explanation for housing costs, logic dictates that something else must be afoot. There is a fairly large goodie bag of these something-elses, but they are always fundamentally about pathways for external demand to enter and distort local market conditions: money laundering crime lords, capital from unstable regions flying to the local real estate of safer countries, foreign and local speculators turning houses into tax-advantaged capital gains, Wall St. and Bay St. financializing local housing in order to transfer wealth from residents to shareholders, wealthy tourists displacing locals via AirBNB conversions.
Like any good story, there is always an element of truth at the core. And like any good Boogeyman, a lack of information prevents us from ruling them out entirely. The issue with these explanations is not whether they are completely fabricated; most are true to some degree and documented to have occurred somewhere at some time. The issue really is whether they are happening locally, and if so, are they to a degree that would have a material effect. In our view, there are enough conventional and locally-based explanations for our housing conditions in this region. Occam’s Razor and all that…
Having said that, we fully agree with at least one of the proposed mechanisms by which outside demand has been imported into our local markets: the proliferation of short-term rentals. The number of housing units in our communities now dedicated exclusively to providing short-term accommodations on a commercial basis has exploded since the global advent of AirBNB and its imitators just a few years ago. While there are some interesting and ultimately beneficial facets to this trend, what demands the most attention currently is the resulting reduction in housing supply available for traditional forms of tenancy.
In response, we have invested in access to world-leading data services covering this new sector of the real estate market. Currently we have market data coverage for all of Nova Scotia at the individual listing level, updated monthly. We have a few interesting extra-curriculars in the works for this resource, but alas, these are busy days and client needs come first (seems like a certain provincial government should be beating down our door on this one, but I digress). In the meantime, here is why Short-Term Rentals have our attention:
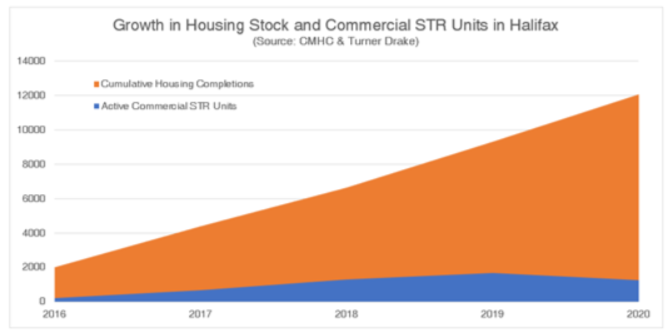
This chart shows the growth of housing units (CMHC tracked housing completions) against growth in what we estimate to be commercially operated STR units (i.e. entire-home AirBNB listings that spend the majority of the year available on the platform rather than housing a long term resident). Starting with only a couple hundred in 2016, commercial STRs have grown rapidly, peaking at nearly 1,700 units in 2019. This negates about 18% of the 9,300 housing units completed in the municipality over the same timeframe. In a time when we need all the supply we can get, this is an unnecessary headwind. At the same time, these overall numbers are not earth-shattering; it’s hard to imagine that conditions would be that much different if the industry had been able to pump out 11,000 units instead of 9,300 over those three years.
However, those are the overall numbers. The short-term rental market is not dispersed evenly throughout the housing market, it is having vastly different impacts within Halifax. Some locations have no loss of housing availability, others are under significant pressure. To illustrate, though STR units peaked at 18% of completions for HRM overall, if we narrow our analysis to just the Peninsula, that figure jumps to about 30%. You can imagine how that may escalate further looking at some of the high-demand neighbourhoods.
More on that in the future.

Whew, you made it to the end, but when it comes to housing issues there are no shortcuts! This is an immensely important challenge and we’re trying to do our part. We are proud to support the work of Nova Scotia’s Affordable Housing Commission through our involvement in their Data and Financial Modelling Working Group. Of course, Turner Drake is also engaged in numerous consulting assignments, including non-market housing feasibility studies, and Housing Needs Assessments from coast to coast. To see how your community can benefit from the unique expertise of our Planning and Economic Intelligence team, call Vice President Neil Lovitt at (902) 429-1811 or .