
Another few years passed, another resurgence of attention and debate on Nova Scotia’s Capped Assessment Program. Municipalities are once again beating their drum against it, reiterating well-worn criticisms and receiving well-worn rebuttals. The public is largely disinterested, unfortunately, and the Province is loath to make the necessary changes without a strong call to action. The issues are not intuitive, and the impacts are largely invisible, and thus the CAP has immense political inertia.
With governments thankfully enacting open data policies, making publicly funded data publicly accessible, Turner Drake & Partners has now been able to crunch the numbers for more than 140,000 taxable residential assessment accounts in the Halifax Regional Municipality (HRM) to show just how ineffective this public policy has become.
What is the Capped Assessment Program?
The mechanics of the CAP, and the basics of its problems, have been explained many times over. Sources abound, but our own Property Tax professionals have previously covered the topic in our blog, as well as our recent company newsletter.
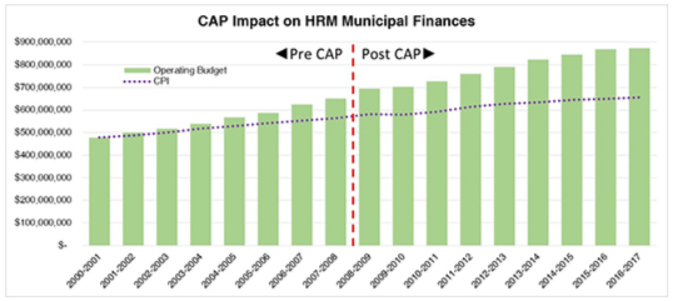
Normally, assessments are free to track market trends, but in Nova Scotia the CAP limits annual growth in a property’s assessment to inflation. Nova Scotia’s CAP is not like other taxpayer protection measures, such as California’s famous Proposition 13 which limits growth in assessment and total revenue collected. In Nova Scotia, if the total assessment base is reduced because of the CAP, tax rates are simply increased. Based on our analysis for HRM, we see no evidence of an impact on municipal spending. Operating Budgets have grown consistently since 2000:
Therein lies the problem. It is a program that only redistributes the tax burden. Some pay less, but the taxman gets his due, and so others pay more to make up the difference.
What is the Problem?
The problem arises in how the CAP decides who is to pay more. An assessment-based property tax system is not perfect, but one of its strengths is that property values generally correlate well with a household’s ability to pay. Of course this is not always true, and in fact the original purpose of the CAP was to alleviate situations where rural families were being priced off their land because Ethan Hawke bought the island next door. This is a valid issue that deserves a policy response, and we know that the CAP has helped people in this regard. However, by taking a broad based approach to solving a very acute issue, the program has created far more inequity than it was ever able to solve.
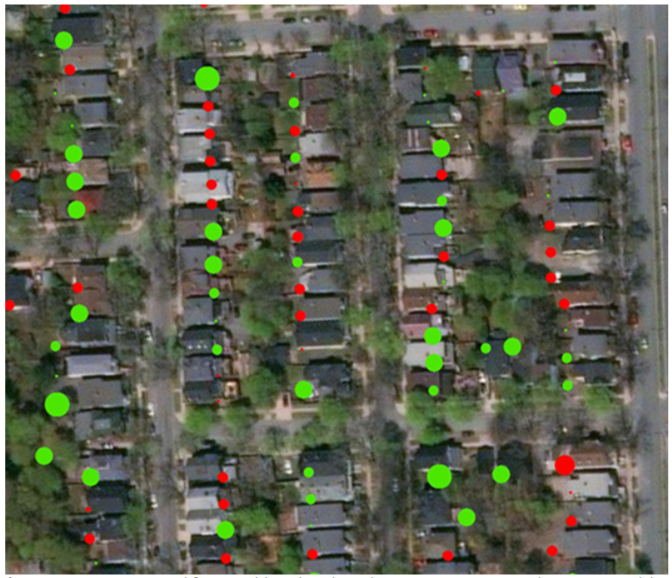
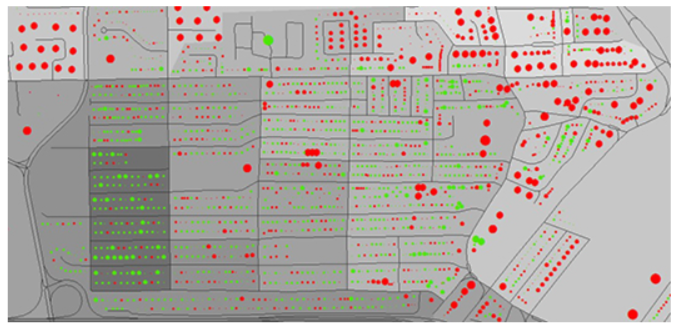
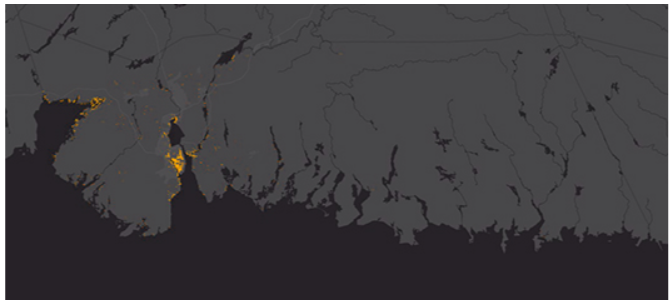
The CAP introduces distortion to the assessment system, reallocating tax burden based on occupancy length and tenure type. Most critics frame this issue as being arbitrarily unfair and use maps like the one below to illustrate the random nature of its distortions; houses in the same neighbourhood, with the same services, but carrying different tax burdens.
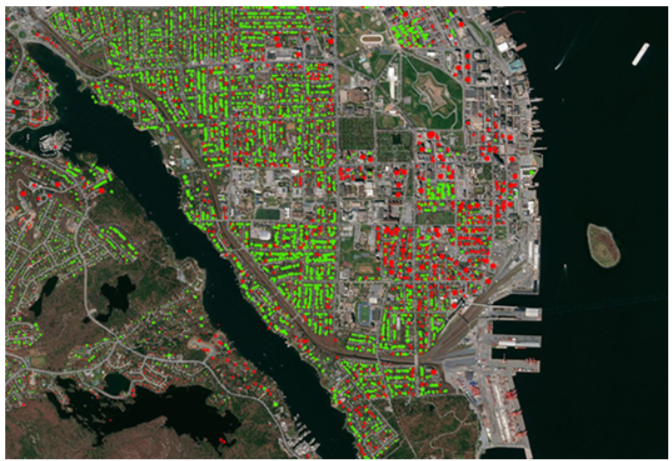
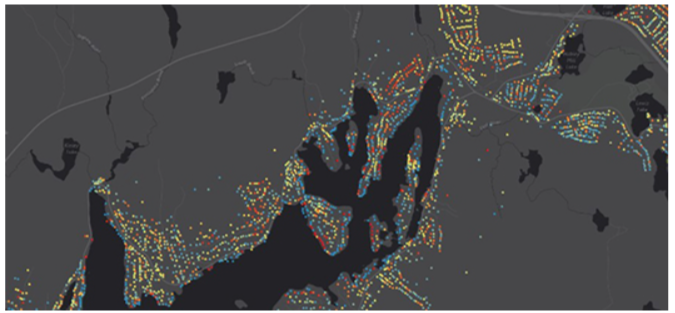
The sad truth is that its unfairness is less random, and its benefit more misallocated than most assume. As our Economic Intelligence Unit knows, people tend to sort themselves into similar locations and types of housing depending on their backgrounds, economic status, and life-stage. Thus, the CAP doesn’t just discriminate against certain properties on the basis of eligibility and program mechanics; it by extension discriminates against certain locations and people. This becomes apparent as the map zooms out:
Today the CAP is championed as the way to bring “stability, predictability and affordability” to the taxpayers writ-large. In reality, the CAP generally fails to deliver these supposed benefits, while systemically giving the greatest assistance to those that least need it, by taking from those who can least afford it.
Halifax Case Study
To help illustrate the outcomes of the CAP, Turner Drake’s Economic Intelligence Unit compiled data from the Property Valuation Services Corporation’s DataZone for the 2017 assessment year, budget and tax rate data from the Halifax Regional Municipality’s website and Open Data Portal, and socio-economic data from Statistics Canada. Assuming the municipality would uniformly adjust tax rates to offset the 11% increase in assessment under a CAP repeal, our analysis allows us to estimate who is currently paying more and who is paying less, by how much, and whether these outcomes have social or spatial patterns. Every municipality is different, but with HRM comprising the greatest variety of settlement types, 44% of the population, and 55% of the total provincial assessment base, we find the results instructive.
Results
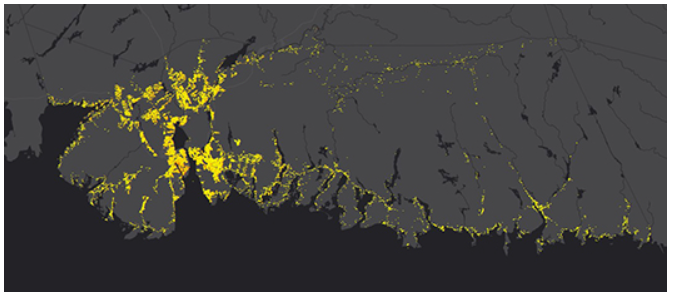
Urban – Spatial patterns in the urban areas are remarkable. Whether your kitchen has a view of the Northwest Arm seems to be the strongest predictor of tax savings, though much of the Peninsula’s west side makes out well. The apartment-heavy downtown and North Dartmouth areas are hit hard, while suburbs (unless recently developed) generally overpay, but just slightly. Aside from a small number of waterfront areas, Bedford and the developing suburbs are not saving much. Sackville and Spryfield are a mixed bag, with recent development in those areas hardest hit.
Rural – Compared to urban areas, rural areas tend to be more random as new construction and sales activity is dispersed while “hot” market areas tend to be highly targeted. The Chebucto Peninsula appears to make out reasonably well overall. The Head of St. Margaret’s Bay area is most favoured, while farther flung locations like Prospect have a more even balance.
Unfortunately for the Eastern Shore, it looks like the shorter the drive to the city, the better your tax relief. Porter’s Lake is a mixed bag, and most communities past Jeddore pay a little bit more. Sheet Harbour is case in point, a very small handful of savers while most overpay mildly. The hardest hit property is a nursing home which pays an additional $5,000 in property taxes under the CAP. In aggregate, the outer rural areas of the municipality pony up an extra $110,000, while the rural areas within city commute distance save nearly $750,000.
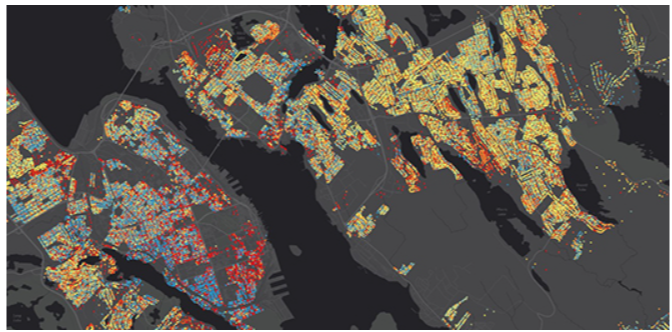
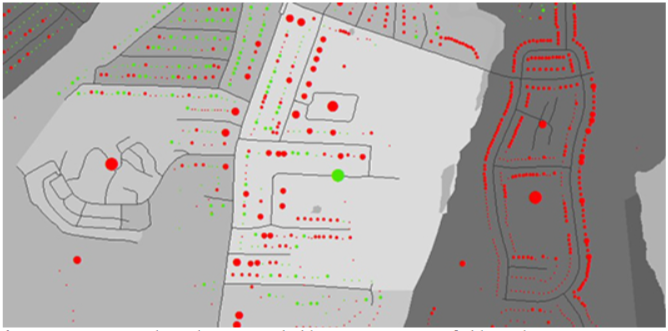
Household Median Income – A strong relationship is observed between tax savings and median household income. Thanks to the mechanics of assessments, the more expensive and fast appreciating properties tend to accrue the largest discounts under the CAP. Shockingly, these desirable, expensive areas tend to be occupied by households of higher income. What is truly surprising, however, is the detail and extent to which this relationship holds true. Even within neighbourhoods that generally trail overall median income levels, tax distortions tended to favour the (relatively) higher income areas:
This relationship varies in strength across the municipality, but only truly breaks down in newly developed areas as new construction starts out uncapped, and tends to attract higher income households due to the premium price of a new home. Spryfield is a case study in getting the worst of both worlds:
The level of income detail in rural areas is less fine-grained, but broadly, we see this pattern repeated when comparing the Chebucto Peninsula to the Eastern Shore.
Much Ado About Nothing
Despite the prolific shifting of taxes among tens of thousands of accounts, for most residential rate-payers in HRM the whole program may as well not exist. We estimate 45% of properties have their taxes adjusted (upwards and downward) by less than $200 per year, with the average bill enjoying less than $10 in savings. If we expand our bounds to adjustments of less than $500, we capture approximately 88% of all accounts, though now on average they have to pay $30 extra. Even at the extreme end of this sample, $40 per month is not exactly a significant level of tax relief. For the vast majority of households, the existence of the CAP does little to foster stability, predictability or affordability over an unadulterated assessment system.
Winners and Losers
With the vast middle-ground essentially playing musical chairs with small dollars, the real impacts are felt in the outliers. The maximum overpayment is limited by the artificial inflation of tax rates (roughly 11%), however the maximum discount has no similar limit; it is dependent on local market trends and the length of time a property remains capped. Thus the program tends to siphon tax dollars from a broad base of chronic over-payers and deliver them in considerable amounts to a relatively small number of super-savers.
The 403,000 souls in HRM are organised into just over 173,000 households; groups that occupy a single dwelling unit (usually based on family relations). Most of these pay more under the CAP. About 30% live in apartments that are not eligible for the program, and thus pay rents inflated by higher property taxes. Another 27% occupy eligible residences, but still pay more because the higher tax rate overwhelms their modest assessment discount (or lack of discount if newly purchased). So more than half, 57%, of all households in the municipality are losers, overpaying by an average of $275 per year. The majority of this unfortunate group will always pay more because their residences do not qualify for the program, or their capped assessment will simply not build up a sufficient discount over time. In total, the CAP extracts around $27 million from this bunch – a hefty sum on top of the taxes they fairly pay.
Around $10 million of this is used to benefit land that is likely vacant but classified as residential, while the remainder is redistributed to the winner households, mostly in small amounts. Yet there are some very lucky recipients of this involuntary largess. Tax discounts in excess of 60% are not uncommon, and there is more than one tony street address that receives a larger tax break than the combined saving of entire mobile home parks.
The top 1% of households are afforded an average tax break of $1,500 per year. In total, this group enjoys more than $2.5 million of tax savings. In other words, it’s likely that the top 1% of beneficiaries are receiving around 15% of the total benefit collected by households, and much of this flows to high-income areas.
The System We Want?
Ultimately, tax policy is public policy, and the most fundamental test of public policy is whether it achieves its ends. It is a good and worthy goal that families not be forced from their homes by sudden tax spikes. It is also good that funding for local government be raised in a way that gives households stability, predictability, and affordability. Does the CAP achieve any of this, and to the extent that it does, is it worth the cost?
Property values and ability to pay are closely aligned, but not perfectly. There are always those who will have difficulty when taxes on the former unexpectedly outstrips the latter. They deserve protection, but the CAP is not a precise tool; for every property owner truly assisted, many others receive unneeded relief, or are undeservedly burdened. Beyond this, most households would experience stability and predictability in their property taxes regardless of the CAP, and the majority would actually have improved affordability without it, if only mildly.
So this is the outcome of the CAP, ten years after full implementation. Are we achieving these feeble results at an acceptable cost? Can we only provide peace of mind in taxation through a system that demands someone else’s sacrifice? Is it acceptable that we systematically target people like rural nursing home residents, low income apartment dwellers, first-time home buyers, and downsizing seniors to make those sacrifices? And is it acceptable that we provide only meagre relief to the residents of mobile home parks and housing co-ops, while systematically directing the greatest savings to neighbourhoods with lowest need? Surely we can do better than this.
©2017 Turner Drake & Partners Ltd. all rights reserved. Contains information licensed under the Open Data & Information Government Licence – PVSC & Participating Municipalities, and the Open Government Licence—Halifax. Analysis and conclusions are the product of Turner Drake & Partners Ltd., and do not necessarily reflect the views or endorsement of Property Valuation Services Corporation, the Halifax Regional Municipality, or any other entity. Whilst every effort has been made to ensure the accuracy and completeness of this document, no liability is assumed by Turner Drake & Partners Ltd. for errors or omissions. This is distributed without charge on the understanding that the contents do not render legal, accounting, appraisal or other professional services.
For more information on this analysis, contact Neil Lovitt, our Senior Manager of Planning & Economic Intelligence at 429-1811 ext. 349 (HRM), 1 (800) 567-3033 (toll free), or .