

Global affairs have dominated the media of late, but the challenge of rising living costs continues to shape domestic politics. It is particularly evident at the local level this time of year. If you own real estate in Nova Scotia, last month you received your updated property assessment, and at this point your local municipal council is likely deep in the throes of setting their budget and tax rates. Though this process is always rife with political theatre, the rhetoric seems especially pronounced this time. There is rarely an appetite in the public discourse for tax policy, believe it or not, so when the stars align for another round of discussion on the province’s Capped Assessment Program (CAP), we simply can’t ignore it!
Nova Scotia’s Capped Assessment Program
For the uninitiated, the CAP is a system that intervenes in the process of determining the assessed value on which a property’s tax bill is calculated. Rather than exclusively using the market-based estimates calculated by Property Valuation Services Corporation (the assessment authority) using traditional mass appraisal techniques, a separate “taxable” value is also determined. So long as the property remains eligible for the program, this value tracks inflation via the provincial Consumer Price Index rather than real estate trends. Without bogging down in details, most residential property in Nova Scotia falls under the CAP; but rental buildings of four units or greater and non-resident owned property are excluded, and recently sold properties get reset to market-based assessment.
It was originally created in 2005 as an application-based program that would limit annual assessment increases to a maximum of 10%. This established a safety net during a time when a sudden influx of deep-pocketed buyers to small, typically rural, markets were generating volatile price trends and rapid assessment increases, creating localized displacement pressures for long-time residents. Sounds familiar…
However, it quickly evolved beyond this limited “spike protection” style system. Politicians realized that appearing to restrain property tax bills was extremely popular with homeowners, a large and important voting bloc. Better still, it cost government nothing! Within a few short years of its introduction, the program transitioned to the far more broadly applied and assessment-restricting CPI-based system we know today.
Take me for example. I had the good fortune to become a homeowner in mid-2016, when housing prices were far more affordable and stable (dumb luck, not prescience). Since my purchase of the property reset its status under the CAP, 2017 was my first full year in the system and saw both the Assessment and Taxable Assessment set at the same value of just over $265,000. Fast forward to 2025, and while my assessed value has ballooned to about $473,000, my CPI-limited Taxable Assessment sits at a much more comfortable $316,000. As a result, the $3,160 tax bill I received in 2017 had only grown to $3,600 by 2025. After years of population growth and a pandemic-driven surge, the assessment authority thinks I’ve gained $26,000 in equity annually, yet I’ve only had to manage a $55 increase in my taxes each year. So, what’s the problem?
Well, there certainly isn’t a problem for me! I’m sure many homeowners are looking at a similar track record and thinking similar things. The issues wrought by the CAP are not readily apparent at an individual level, you have to understand how the details of its policy design work across the system as a whole.
The single most important fact to understand in this discussion is that the CAP does not directly constrain the tax revenue municipalities collect. It only acts on the assessment part of the equation, and only for a portion of the assessment base. It places no limits on a municipality’s ability to set their budgets or tax rates. This means local government still collects the revenue it needs to deliver the projects and services citizens require. Where a municipality’s total residential tax base is artificially lower as a result, this is easily (in effect, automatically) compensated for by similarly pushing residential tax rates higher than they otherwise would be. Despite how it is often framed, the CAP doesn’t produce tax savings overall, only tax shifting between ratepayers. Simply put, it is a zero-sum game; my paying less means someone else is paying more to make up that difference.
Unwitting Patrons
I can’t point to the person or property that is picking up the rest of my tab. My subsidy is rolled up with thousands of others, and by the math that sets municipal tax rates, gets dissolved into the bills that go out to all residential properties. I was a winner in 2025; my assessment discount was still large enough to produce net savings after accounting for this invisible cross subsidy. But for many properties this is not the case, and it’s often not apparent to residents when they are on the losing team.
Obviously, those residing in properties that are not eligible for the CAP are overpaying. But with most multiunit properties excluded from the program, the vast majority of these people are renters who don’t see a tax bill directly and instead have the cost baked into their rent. Yet, in any given year there are also a surprising number of properties that carry what we call “phantom savings”. These are capped properties that carry a modest assessment discount; enough to imply savings to the owner, but not enough to overcome the increased tax rate effect and still end up paying more in the end. Whether they are directly excluded or simply bamboozled with false impressions, the CAP turns many into involuntary benefactors, generously supporting paupers like me. It’s an insidious process, driven by rigid math, policy rules, and market data, not conscious human choices or an evaluation of whether someone needs relief, or can afford to pay the going rate.
The unfairness of this tax shifting is often described with a focus on its randomness, highlighting the many instances of similarly valued properties, in similar locations, receiving similar services, carrying wildly different tax burdens. However, below this layer of noise, there are also consistent patterns in the type of people who find themselves as winners or losers. Sometimes the outcomes produced by the CAP align need with benefit, but often this is not the case.
Revisiting Outcomes
In 2017 we published a detailed analysis of the CAPs impact across the Halifax Regional Municipality, highlighting how it systematically shifts the tax burden in ways that are misdirected or regressive. To summarize, we calculated every property’s status quo tax bill, as well as a hypothetical bill based on their uncapped assessment, but a lower tax rate that would maintain revenue neutrality for the HRM (i.e. a CAP repeal that doesn’t serve as an opportunity for the municipality to increase their take). By comparing the two we could calculate who was winning or losing, and by how much, as a result of the CAPs tax shifting effects. We estimated that the majority of households in HRM actually paid more tax with the program in place; renters living in buildings that are not eligible, recent purchasers (like newcomers, first-time buyers, and downsizing empty nesters) that had the CAP reset as a consequence of the transaction, as well as a surprising number of those phantom savers who don’t achieve a significant enough discount due to being located in areas with lower values and less appreciation (i.e. not the wealthy, desirable enclaves).
Things have changed quite a bit since 2017. The real estate market has experienced remarkable growth and volatility compared to the lead up to our prior analysis. On one hand, this presents exactly the kind of conditions that the CAP was intended to mitigate, so perhaps it’s performing a little closer to expectations at this time. On the other hand, the magnitude of distortions in the system, and the amount of tax shifting that is occurring, has grown. It’s time for an update to see how it all shakes out and who is wearing the CAP in 2025. With support from RHPNS, we’ve repeated our methodology with updated assessment and tax rate figures, and are ready to answer the question.
Results: Broader Beneficiaries, Deeper Burdens
As suspected, with the rapid growth in property values over recent years, the CAP is shielding more households and to a larger degree. There are now far fewer eligible properties hit with those previously described “phantom savings”. The other side of this coin is that the households which are penalized now carry a much heavier load. In effect, the CAP has become far more polarized between eligible and ineligible properties, with the tax burden on the latter being more concentrated, more visible, and harder to dismiss as “small dollars.”
Our 2017 analysis estimated that roughly 57% of HRM dwellings were collectively overcharged, paying an extra $27 million collectively. Since then, the scale of CAP-driven tax shifting has surged:
- HRM’s untaxable assessments in 2025 totaled $23.6 billion. As a consequence, its residential tax rates were 37% higher than they would otherwise need to be if those missing billions were included. Accordingly, the total penalty born by overpaying properties has ballooned to an extra $81.5 million, over $1,000 each.
- A slightly smaller share of dwellings now overpay (49%, down from 57%). The shift to the winning team is heavily focused on single-family dwellings lower down the value chain. Compared to 2017, the program is performing better in terms of extending protections to less valuable housing.
- Yet, around 101,000 dwelling units are left with the burden of paying for others’ subsidy, largely consisting of rental apartments. So, while the CAP expands its protection in one regard, it is simultaneously amplifying and concentrating its negative impact on households least likely to afford it.
- Though less common, phantom savings continue to exist. Previously estimated at 27%, in 2025 only 13% of the dwellings that have a lower taxable value than assessed value still pay more in the end because their discount is not enough to negate the elevated tax rate. On average, they overpaid by $664 in 2025, while likely thinking the CAP was saving them money.
Figure 1 illustrates our estimation of how the CAP redistributes the tax burden across the residential tax base, comparing owned and rented dwelling in 2017 and 2025. In both years, the CAP creates a clear divide between units that benefit (would pay more if the CAP was removed) and units that are burdened (would pay less if the CAP was removed), but the polarization in 2025 is stark in comparison.
Figure 1: Share of Dwelling Units by Tax Savings / Penalties* by Tenure, 2017 vs 2025 (inflation adjusted to 2025)
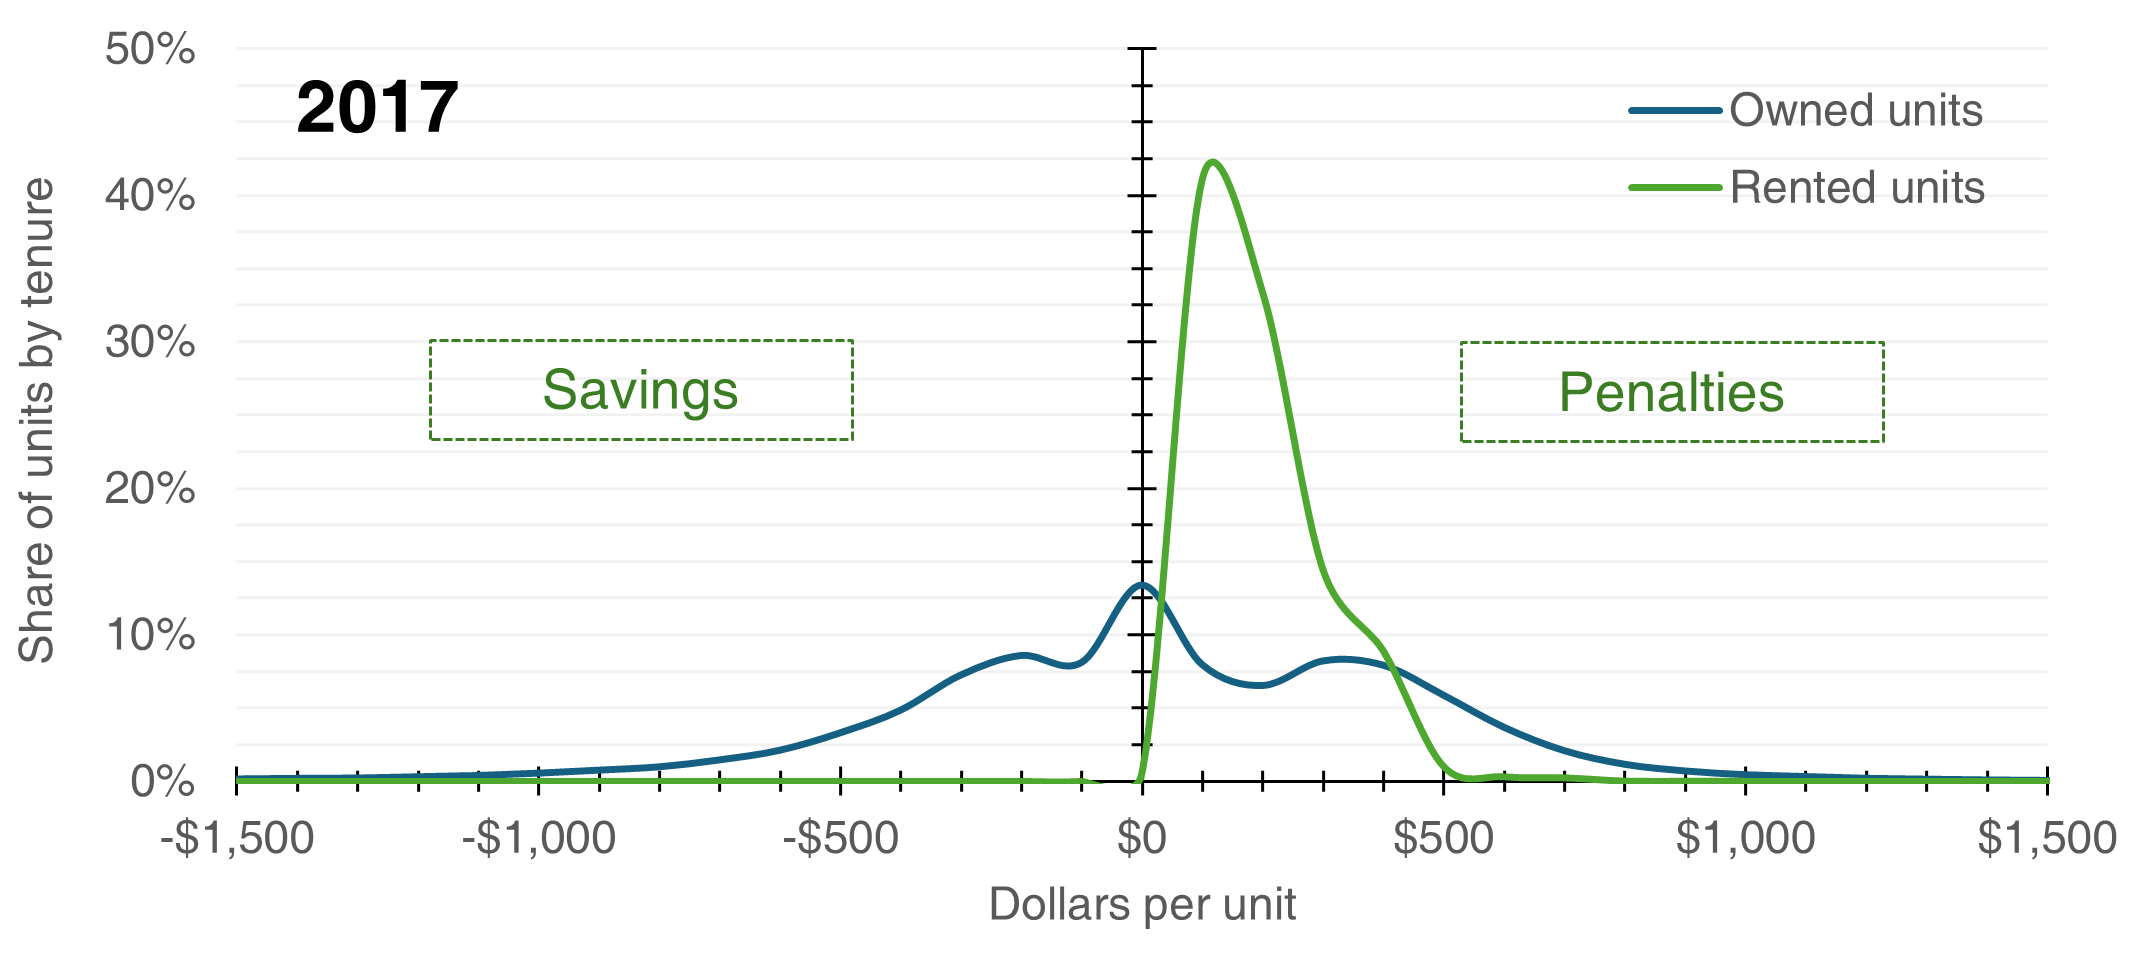
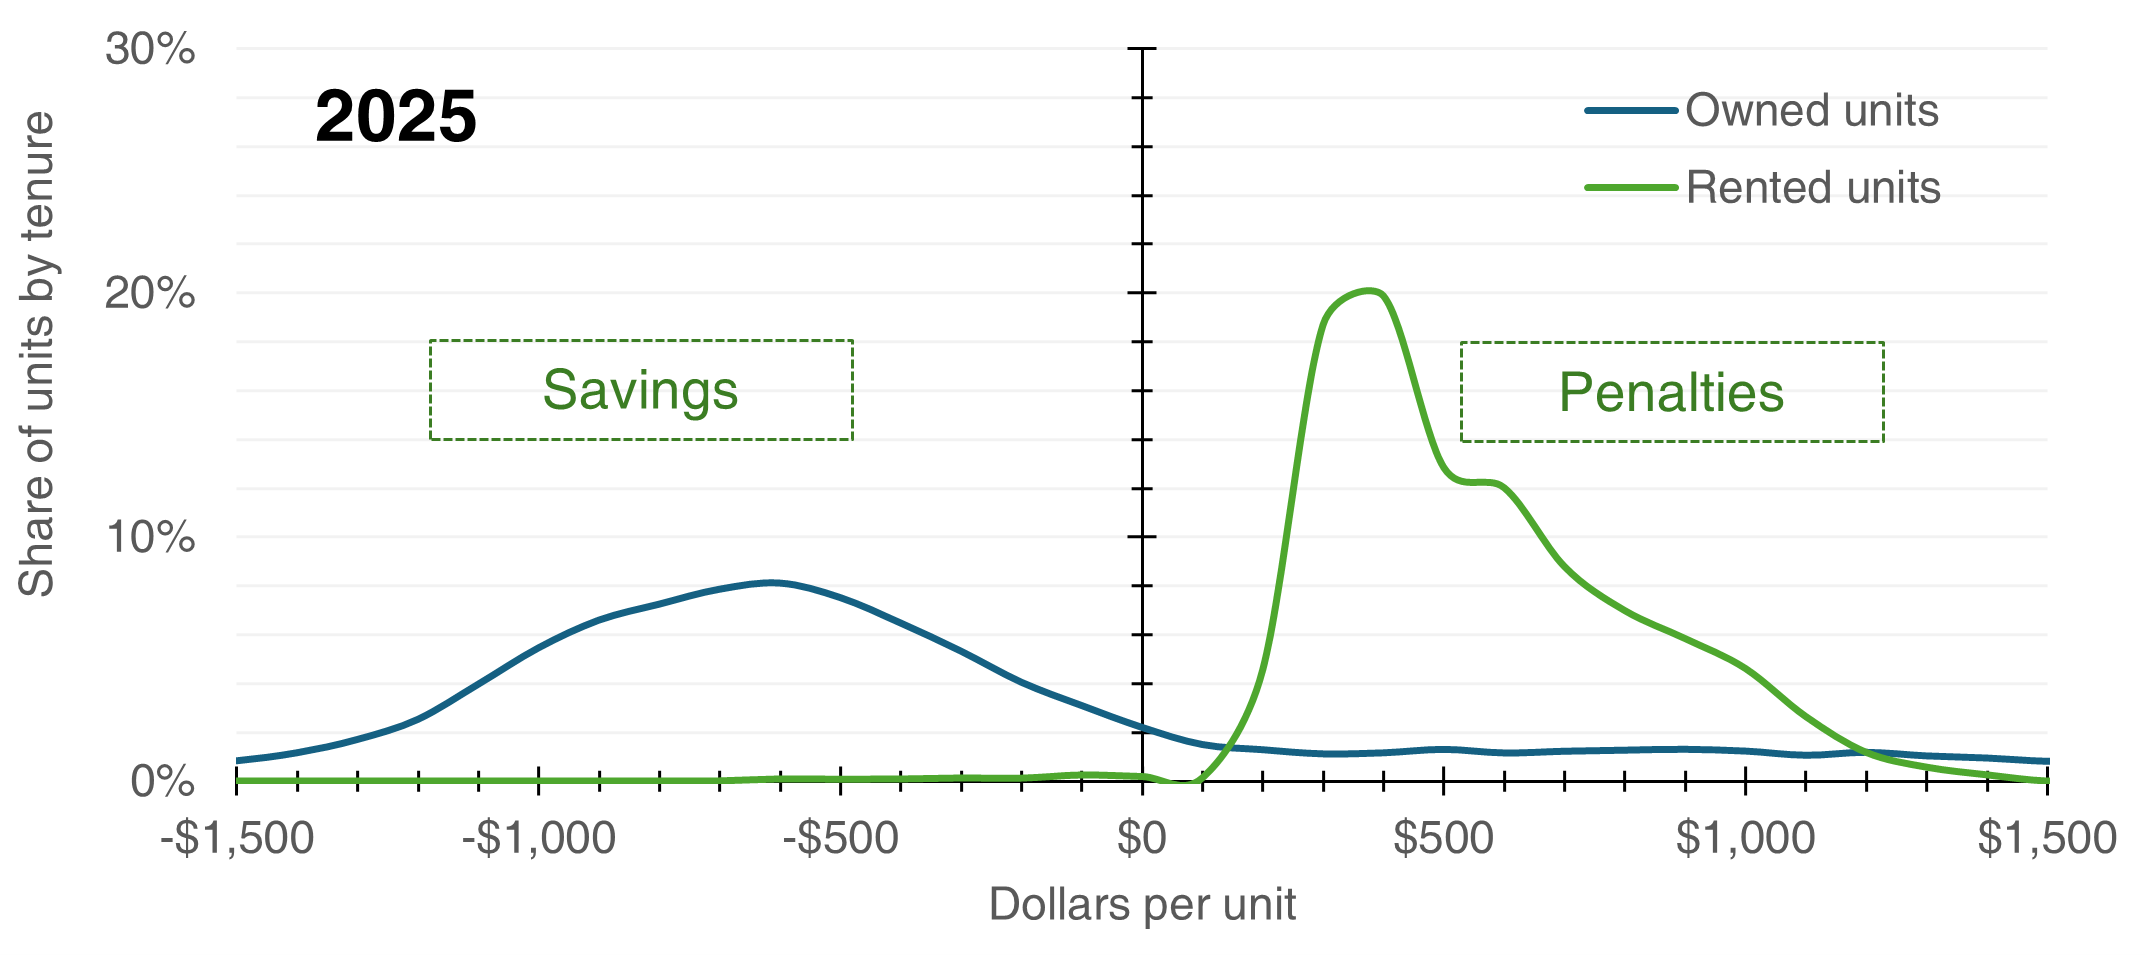
Source: Turner Drake & Partners Ltd. based on analysis including data from PVSC & Halifax Regional Municipality. *Savings are represented by negative numbers, meaning they are paying less under the CAP than they would otherwise. Penalties are the opposite; they are paying more under the CAP than they would otherwise.
Far more owned units fall on the winning side of the ledger in 2025 (77% vs. 44% previously), and this has raised the stakes considerably for renters. The heavier burden concentrated on their shoulders is evident in the widening of their distribution curve; where virtually no rental units overpaid by more than $500 previously, the average in 2025 was $528, and figures in excess of $1,000 are not rare! For context, CMHC reported median apartment rent in HRM grew by 89% between our two studies. Eye watering as that may be, it’s rather quaint in the face of a 310% increase in the average apartment CAP penalty over the same timeframe.
Results: Fairer, but Still Regressive
As renter households earn far lower incomes than owners across all age groups, the overall shifting of more tax onto their shoulders is clearly regressive. However, the regressive outcomes within owner-occupied housing have at least been diluted. In discussing our 2017 analysis, we focused on the pattern of localized concentrations of benefit as the CAP was basically a wash for most owners, and phantom savings abounded. Typically, modestly valued homes were slightly overcharged and there was an unfortunate tendency to penalize the lowest end of the value range, likely due to these properties being located in less desirable areas that did not experience much appreciation over time.
Those patterns were not true at the very upper levels of value; hidden within broader averages were surprising pockets of largess. The top 1% of winners received upwards of 15% of the total benefit created by the CAP, and these super savers were largely concentrated in a handful of high-income enclaves.
To be sure, the super savers still exist and are doing quite well. Looking just at the top 100, the average subsidy value has grown by nearly 90%, now approaching $8,000 annually. It’s hard to see the social value in extending this largesse to properties that, on average, have a market-based assessment of $2.85 million and waterfront on the Northwest Arm. However, this is no longer the whole story.
The CAP has problematic, unintended consequences. Its one intended consequence is to buffer household budgets from sudden and dramatic spikes in property tax when market trends diverge from income trends. Our pandemic-driven market frenzy is precisely the kind of scenario the CAP was designed to address; residential assessments across much of the province leapt significantly, circa 2022-2023. The good news is that with much more of the property base under its umbrella, tax relief to owners is much better distributed toward more modestly value properties. Figure 2 compares the change in average tax subsidy created by the CAP between our two analyses, illustrating how dramatically the savings have grown among properties assessed below $600,000. While far from an ideal outcome, the tendency to overcharge the lowest value properties has also been meaningfully reduced.
Figure 2: Average Tax Subsidy* for Owned Dwellings, by Assessed Value Ranges
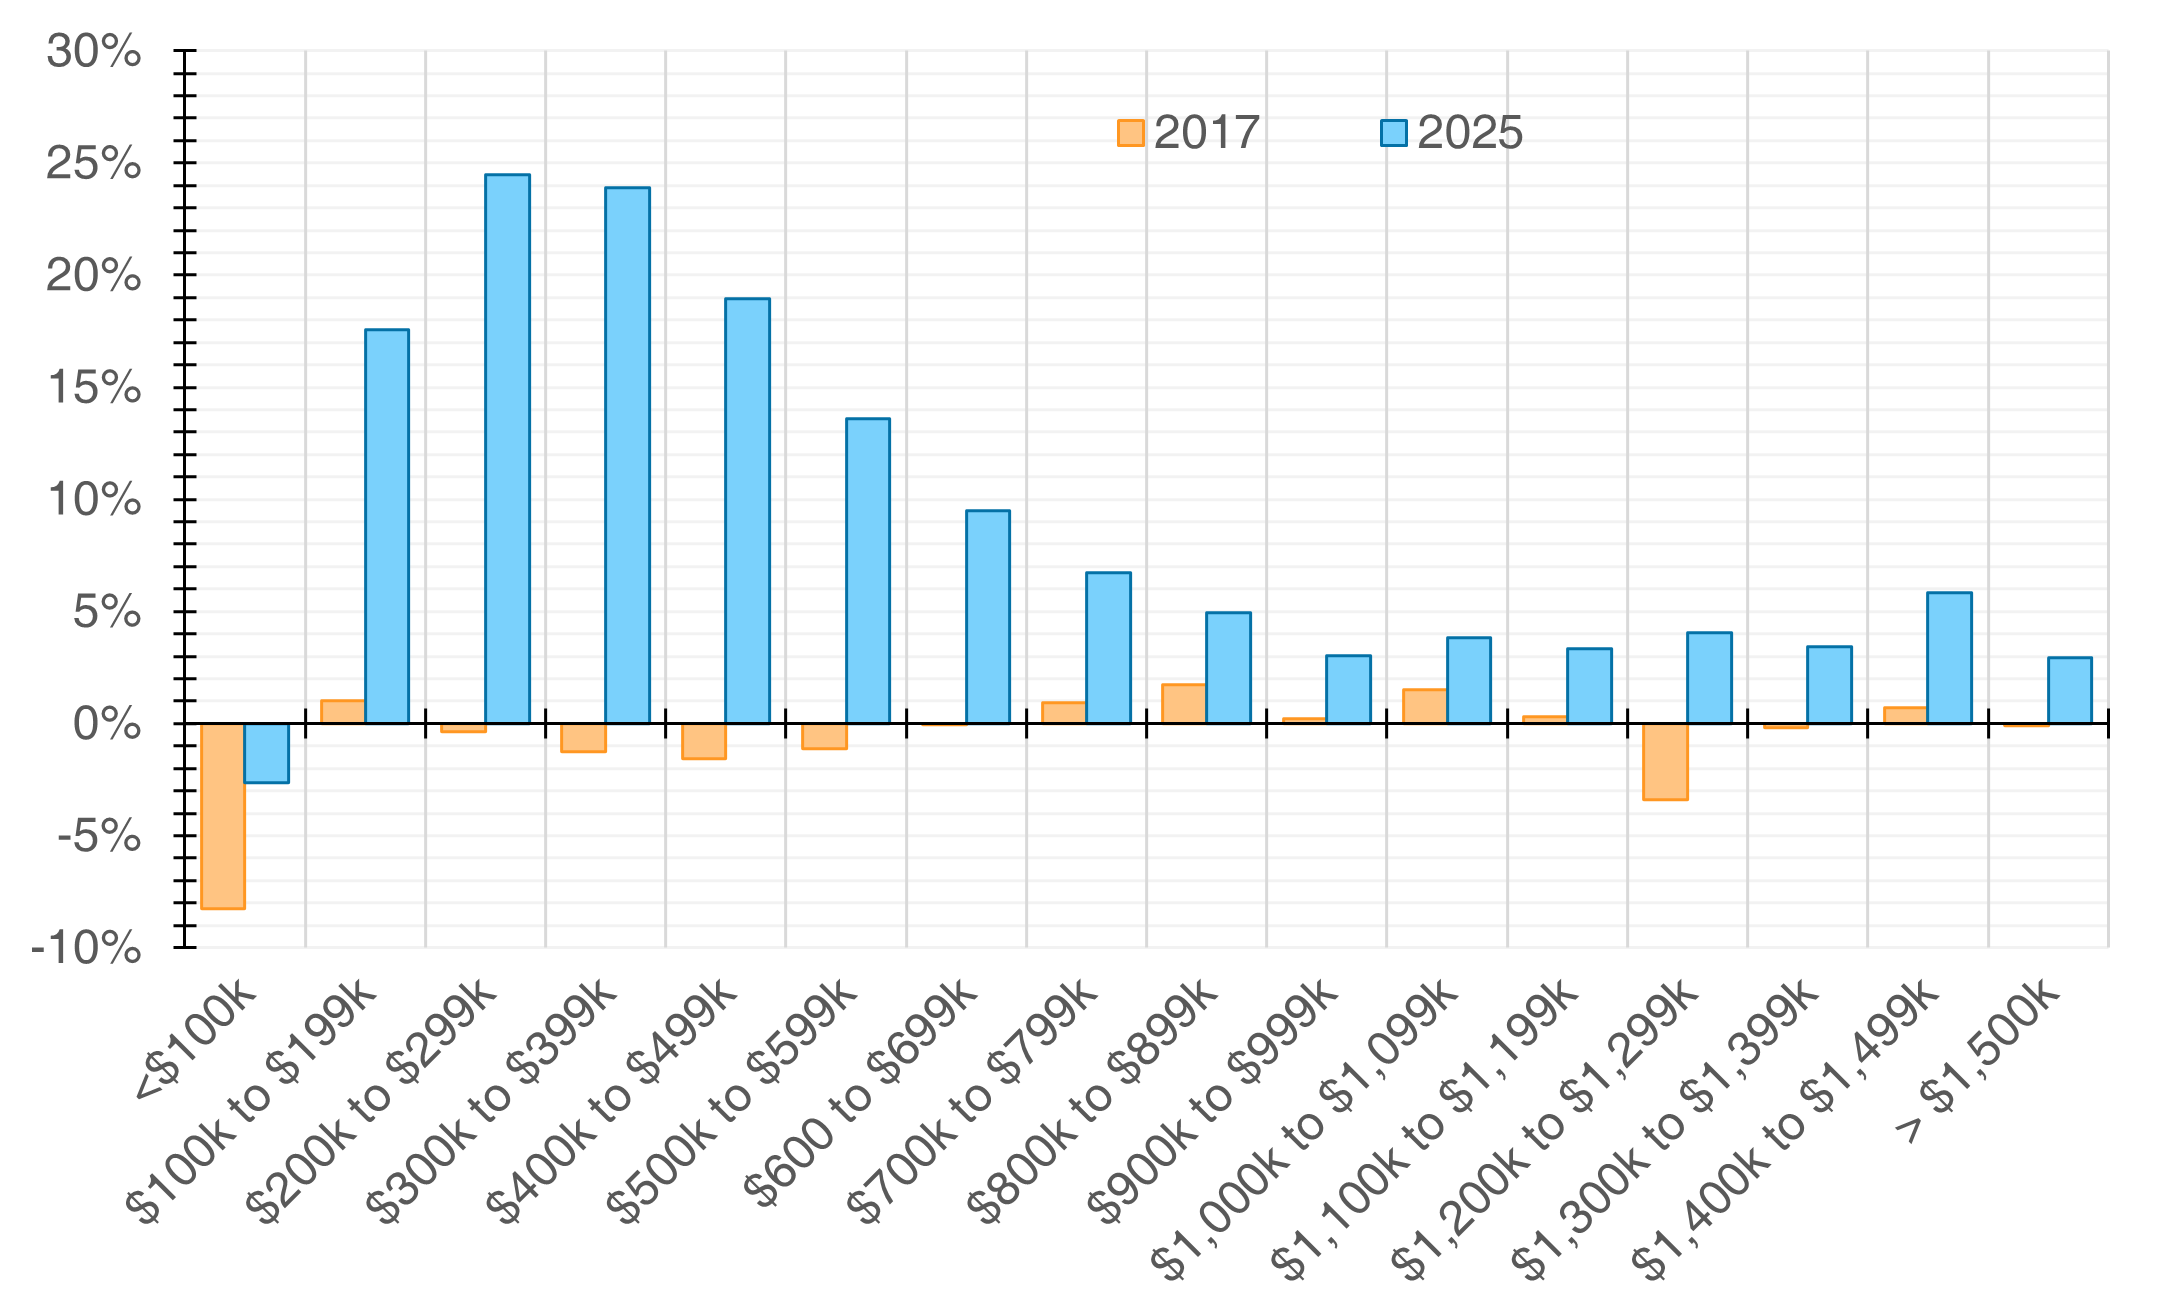
Source: Turner Drake & Partners Ltd. based on analysis including data from PVSC & Halifax Regional Municipality. *Percent discount relative to taxes that would be paid without the CAP, negative values indicate a current tax increase over what would be paid without the CAP.
On this front, there is no denying that more good is being achieved in 2025 than was in 2017. With the generational disruptions and price escalations that have transpired over the last five years, we certainly hope so! If there was ever a time for the CAP to shine, this is it. Yet, this improvement is not absolution. None of the program’s critics, ourselves included, have dismissed the need for some manner of policy protection for property owners against undue burdens and displacement. The question remains, as it always has, whether the CAP is delivering such outcomes with acceptable accuracy, efficiency, and fairness.
Results: Geography Matters Less
One of the more striking changes is how spatial patterns have dissolved. There is always variability and inconsistency in who wins or loses under the CAP, but our 2017 analysis showed that as you zoom out from the neighbourhood block, regressive correlations between high incomes and generous tax subsidies become apparent. While those relationships still exist in the data, market turmoil has given the Etch-a-Sketch a good shake and broken down their strength. Maps of CAP subsidies and penalties now are little more than a map highlighting rental apartments and recently transacted or constructed owner-occupied housing.
Implications for Policy and Politics
Our updated findings show that the CAP is performing both better and worse in comparison to nearly decade ago. It is cushioning owners from the shock of pandemic‑era assessment spikes, and doing a better job directing the benefit to more modest homes. However, it has achieved this by loading a much heavier burden onto households that are likely to have even less room in their budgets.
These tax penalties shape the supply side of the rental market, raising the floor on market rents, working against the sustainability and renewal of older housing stock, encouraging conversion of rental tenured housing to owner-occupation, and serving as a headwind on new supply. From a development economics perspective, the capitalized value of the tax penalty levied on apartment units in HRM is a greater barrier to project viability than the combined total of building permit fees and development charges. Considering the provincial government’s stance against increasing costs on new supply, this fact casts a long shadow.
There is no simple technocratic fix hiding in the wings. Extending CAP eligibility to currently excluded stock, for example, might feel like a convenient solution. Yet, it wouldn’t alleviate tax shifting effects, so in practice would be more like whack-a-mole. Putting apartments under the umbrella would narrow the gap between owners and renters, but the resulting upward pressure on residential rates would erode much of the benefit, or shift the burden onto the already heavily taxed commercial assessment base. The underlying math does not disappear simply by broadening eligibility.
Nor is a “do nothing” approach particularly defensible. The program’s benefits are not targeted based on need; they are a derivative of when and where someone bought, and how the local market has trended since that time. Virtually everyone on the winning side understandably appreciates the breathing room and is loath to give the subsidy up, but many (myself included) have to be honest with ourselves that this benefit is a nice-to-have, not the lifeline it is so often described as. This perk becomes even harder to justify knowing the increasingly heavy cost of the program is borne by renters, first-time buyers, newcomers, downsizers, and the same housing supply that all levels of government are trying hard to expand.
From a political perspective, the incentives are clear. A few years after our original study, the government of the day cautiously broached the topic of CAP reform by striking an all-party committee to review it. I was invited to kick things off with a presentation of general background on the program itself, as well as a separate session on the findings of our research at that time. From my vantage point, each word of discussion around the table was very carefully chosen, and the entire proceeding had the nervous energy of a dog in a veterinarian’s waiting room; unsure why they were there, intuitively confident that nothing good was in store, and struggling not to make a break for the door. Media coverage quickly sparked ratepayer opposition, and the whole venture was quickly smothered in the cradle.
It was too hard of a conversation to have then, apparently, and the share of voters who now clearly benefit has only increased since. There is little political upside and enormous perceived downside for any government contemplating a material rollback. The CAP has been a third rail since the moment it was put in place, and this has never been more true than it is today.
That does not mean better policy is impossible, and at least we are free to muse about it. A phased‑in repeal of the CAP, paired from the outset with a durable, means‑tested property tax relief mechanism, remains the most sensible way to unwind the current distortions while preserving genuine protection for those at risk of being taxed out of their homes. That approach would preserve the ability for interventions where needed, while removing the broad distortions that drive its regressive impacts.
A return to the original 10% cap threshold or something similar, rather than the current CPI lock‑in, is perhaps a more palatable middle ground. This would maintain the broad, automatic applicability of the system and the sense of security that many value. It would leave in place a mechanism for smoothing dramatic spikes regardless of household means. However, it would lack the ability to ensure deeper and more persistent support for households that truly need it. Our modelling suggests that for properties continuously capped since 2017, roughly 7% of assessments would be untaxable under a 10% cap in 2025, compared to the current 43%. Under this approach some properties receive a subsidy in some years, taking the sting out of volatility, but catch up over the less dramatic years and avoid the permanently hard‑coded inequities we see under the status quo. There are undoubtedly a number of other creative ideas worth considering, like capping the CAP itself, as recently discussed by fellow wonk Deny Sullivan (his Substack writings in general are highly recommended). Yet, without an appetite to seriously discuss the need for reform, and bring the public along, imaginative policy alternatives will remain imaginary.
The Conversation We Keep Avoiding
The unvarnished truth is that the CAP exists, and persists, for political reasons that do not get said out loud. It is popular because the impression of tax savings is visible and intuitive for a large voting bloc, and the resultant costs are scattered out of sight. While we do not want to understate the validity of challenges it was meant to address, only a minority of owners are ever truly at risk of displacement or material hardship without the CAP in its current form.
For most, the appeal is simpler: people like paying less property tax, and they like having a sense of stability about what they will owe next year. All else equal, acting on those instincts does not make anyone greedy or immoral; it makes them normal. But all else is not equal. One person’s relief is another’s burden, and the truly vulnerable homeowners that the CAP was originally designed to protect have become a convenient human shield for the much larger group whose primary motivation is simply their desire to not lose a nice‑to‑have benefit.
If the CAP disappeared overnight, owner‑occupied properties in HRM would, on average, pay about $550 more per year in tax. That is not nothing, but it is less than the additional tax that is already being heaped onto apartment units which house the vast majority of lower‑ and fixed‑income households. The status quo is more Sheriff of Nottingham than Robin Hood.
For many long‑tenured owners, the reality is even less defensible. The CAP does not stop at keeping the bill to a reasonable level of growth, but has quietly pushed them into paying even less tax over time. As new development and growth in uncapped assessments expand the tax base, municipal tax rates tend to fall even as their revenue rises. Combine decreasing rates with an inflation‑limited assessment, and the result is absolute decline in tax liability. I am one of these little robber barons, and I am not an outlier. Revisiting my own example of a $440 increase in taxes over eight years, after putting things in real dollars rather than nominal, it turns out that I actually paid over $300 less compared to my bill in 2017. We estimate that more than 55,000 residential properties in HRM, roughly a quarter of the entire housing stock, have been capped continuously for this same time period and have had their taxes reduced by an average of $170 as a result. Far from merely holding the line, the CAP has me and many others contributing less toward the cost of running our community, despite hundreds of thousands of dollars in windfall equity gains over the same period. Despite perceptions, the reality for many has been moving in the opposite direction of the “squeezed taxpayer” identity they may nevertheless align with.
Tax policy does not have to work this way, and it is clear that many benefits would result if we could bring ourselves to make changes. The obstacle is not technical design, but the political reprisal that accompanies taking away something that has broadly come to be seen as normal, if not deserved. Most CAP beneficiaries do not see themselves as privileged, and understandably so; not living on the edge isn’t the same as living high on the hog. But this is ultimately not a question of whether residents deserve stability in volatile times; they do regardless of tenure. It is about who actually needs it, and how those costs can be fairly shared among the rest.
Changing the CAP is undoubtedly a more difficult conversation now than it was in 2017, but regardless of the timing, it will remain impossible until we can collectively acknowledge the big picture and not just our own small piece of it. For years the system has asked less of people like me, and more of those with far less to spare. When it is most important, it simultaneously imposes the greatest burdens. If we cannot acknowledge this reality, then insisting the CAP is untouchable begins to look less like defending those in need and more like demanding an indulgence we have grown accustomed to.

Neil Lovitt is our Vice President of Planning & Economic Intelligence, and therefore gets to take credit for the efforts of several colleagues involved in producing this analysis. For more information, you can contact him at (902) 429-1811 x349 or .
©2026 Turner Drake & Partners Ltd. all rights reserved. Contains information licensed under the Open Data & Information Government Licence – PVSC & Participating Municipalities, and the Open Government Licence—Halifax. Analysis and conclusions are the product of Turner Drake & Partners Ltd., and do not necessarily reflect the views or endorsement of Property Valuation Services Corporation, the Halifax Regional Municipality, or any other entity. Whilst every effort has been made to ensure the accuracy and completeness of this document, no liability is assumed by Turner Drake & Partners Ltd. for errors or omissions. This is distributed without charge on the understanding that the contents do not render legal, accounting, appraisal or other professional services.