
There’s an old episode of the Freakonomics podcast entitled Why Are Japanese Homes Disposable?, which originally aired in 2014. The upshot of the pod is that while land in Japan retains its value over time (sort of…the pod is worth a listen!), the houses on it do not, so when “used” houses are sold, they are frequently demolished and replaced. When I came across the episode, we were in the midst of record high lumber prices, not to mention a climate crisis, and I had a hard time wrapping my head around the idea of houses only lasting 40 years or so. And then I thought I’d like to look a little more into construction costs and their impact on housing prices here.
There are three common methods of valuing property: the income approach, the direct comparison approach, and the cost approach. The income approach is only relevant for valuing income producing properties, so not applicable to housing prices per se (though would be relevant for rental properties, but that’s another story). The direct comparison approach and the cost approach are both based on the general premise that similar things will have similar values. In direct comparison, you’d pay for a house what everyone else is willing to pay for a comparable house in the same or a similar location. In the cost approach, the premise is that you’d pay for a house the same amount it would cost to buy some comparable land and build the same house. Thus, rising construction costs should push up housing prices and vice versa.
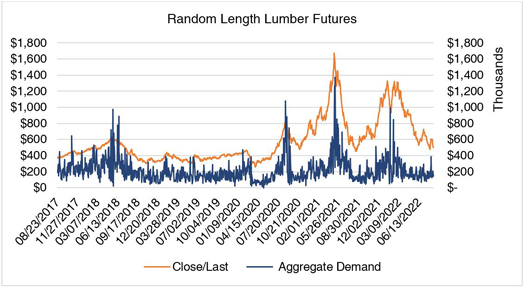
One of the key components of most houses in Atlantic Canada is lumber. The following graph shows the Nasdaq prices for Random Length Lumber futures contracts (i.e., lumber prices on the stock market) over the past five years. The orange line shows the daily closing price (values on the left axis) and the blue line shows the aggregate demand for the stock (values on the right axis, measured in thousands of dollars), which I calculated by multiplying the closing price by the volume traded that day, so it’s a rough estimate because prices fluctuated throughout each day. I find it interesting that as prices climbed in 2020, the gap between the lines for price and aggregate demand grew, and that while there are definitely some sharp spikes in it over the past two years, aggregate demand did not follow the same upward trajectory as did prices. There is only so much money to be spent on lumber, and when prices go up, demand drops. But, more to the point on housing prices: when lumber prices go up, so too does the cost to construct, and thus on a cost approach to valuation, house values rise.
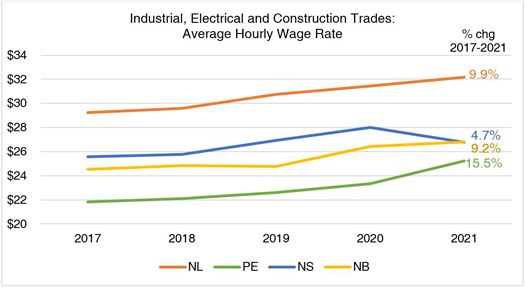
Labour costs also feed into the cost to construct, and with a noticeable shortage of availability of skilled trades in recent times, it stands to reason that labour costs are up. The following table shows average hourly wage rates for industrial, electrical, and construction trades; percentages at the end of the lines are the total change over the period 2017 – 2021. Note the convergence in wages amongst the three Maritime provinces: could this be a marker of increased willingness to move around within the region?
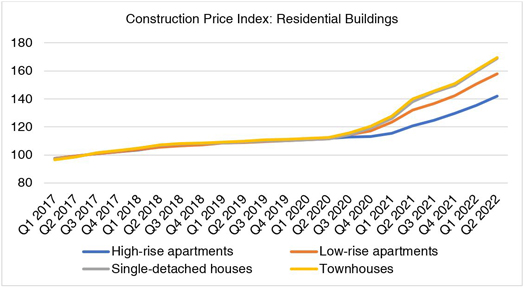
These are inputs into construction prices, which have tidy price indexes available, and it’s interesting to look at the difference in price changes between types of residential construction: single family houses and townhouses have had the sharpest increase, followed by low-rise apartments, with high-rise apartments bringing up the rear. The intuitive difference maker is construction material: high-rises are not typically made of wood (yet – here’s one sample article of many on the topic). The following graph shows the construction price index, quarterly, for a composite of eleven CMA cities, including from Atlantic Canada Halifax, St. John’s, and Moncton. The patterns for each of these cities individually are similar.
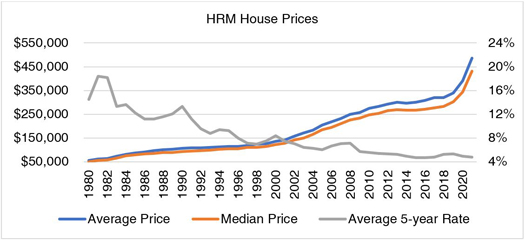
Back in February, we published a blog that looked at interest rates and housing prices. For a quick reference point, I’ll recycle one of the charts from that post:
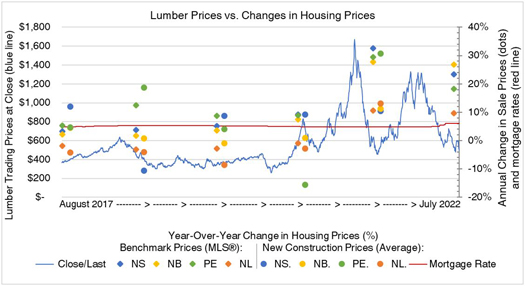
The next chart brings a few of the previous factors together. It’s got lumber prices looking like the heart rate of someone doing sprints, the mortgage rate looking quite lifeless in comparison, and the year-over-year percentage change in house prices annually throughout the chart. Benchmark MLS® prices are shown with little diamonds and are July to July changes; these prices will include some new construction, but the majority of the inventory feeding into the data is existing housing stock (the sort that might be torn down and replaced in Japan). New construction prices are shown with circles and are October to October changes. Notice how the two housing price metrics track each other, and also follow the change in the price of lumber, especially towards the end of the period, when lumber prices were particularly volatile.
Our Planning team is currently working on a Housing Needs Assessment for the province of Nova Scotia. Neil Lovitt wrote a blog post on that topic in April of this year, and in it, he noted that “housing affordability has rapidly eroded over the course of the pandemic, and was being degraded more slowly for years before that.” Lumber prices appear to be coming back to relatively normal levels, though that can change in a heartbeat (take a look at late 2021 to early 2022 on the chart above); interest rates are certainly on the way up, and potentially holding there for a prolonged period. Inflation has been at generational highs over the past few months, and labour costs will have to continue to increase if wages are to keep pace with the cost of living. The latter three make construction less appealing, but we cannot afford to slow provision of new housing options if we want any semblance of affordability or attainability in the housing market. In overly simplistic terms, a lot could be riding on lumber prices.

Alex Baird Allen is the Manager of Turner Drake’s Economic Intelligence Unit. In her role, Alex frequently undertakes market surveys, site selection studies, trade area analyses, supply & demand analyses, and demographic reports for a wide range of property types throughout Atlantic Canada. If you’d like more information on market research or our semi-annual Market Survey (recently updated and published with December 2021 results), you can reach Alex at 902-429-1811 Ext.323 (HRM), 1-800-567-3033 (toll free), or email